Actionable mobile app metrics you should track (with benchmarks)
Oct 09, 2024

On this page
- Sign up and onboarding metrics
- 1. App bounce rate
- 2. Permissions granted rate
- 3. App downloads
- 4. Activation rate
- 5. Average time to activation
- App engagement metrics
- 6. App and feature stickiness
- 7. DAU / MAU ratio
- 8. NPS score
- 9. In-app response rate
- 10. Average session length
- User Retention Metrics
- 11. N-day retention rate
- 12. Churn rate
- 13. Time between sessions
- 14. Reactivation/Resurrection rate
- 15. User lifetime
- App revenue metrics
- 16. Average time to first purchase
- 17. Refund rate
- 18. Revenue per paying user
- 19. In-app purchase conversion rate
- 20. Revenue churn
- App performance and error metrics
- 21. API response time
- 22. API request error rate
- 23. App launch time
- 24. Percentage of users who experience crashes or errors
- 25. p95 errors per user
- Further reading
This guide covers 25 mobile app metrics and KPIs across five categories that can provide valuable insights into your app's success. We've focused on specific, actionable metrics rather than broad ones like daily active users (DAU), or the number of active users, that you know about already.
Jump to a specific category:
- Sign up and onboarding metrics
- App engagement metrics
- User retention metrics
- App revenue metrics
- App performance and error metrics
Sign up and onboarding metrics
1. App bounce rate
What is it? The percentage of users who view your home screen but don't view a second screen.
Why is it useful? Enables you to learn if your welcome messaging is resonating with new users.
Good benchmark: Below 9% is considered good1
Questions to ask:
- How does the bounce rate correlate with downloads from different marketing channels?
- Are users in specific countries more likely to bounce? How does localization correlate with bounce rate?
- How does the bounce rate vary across different devices and app versions?
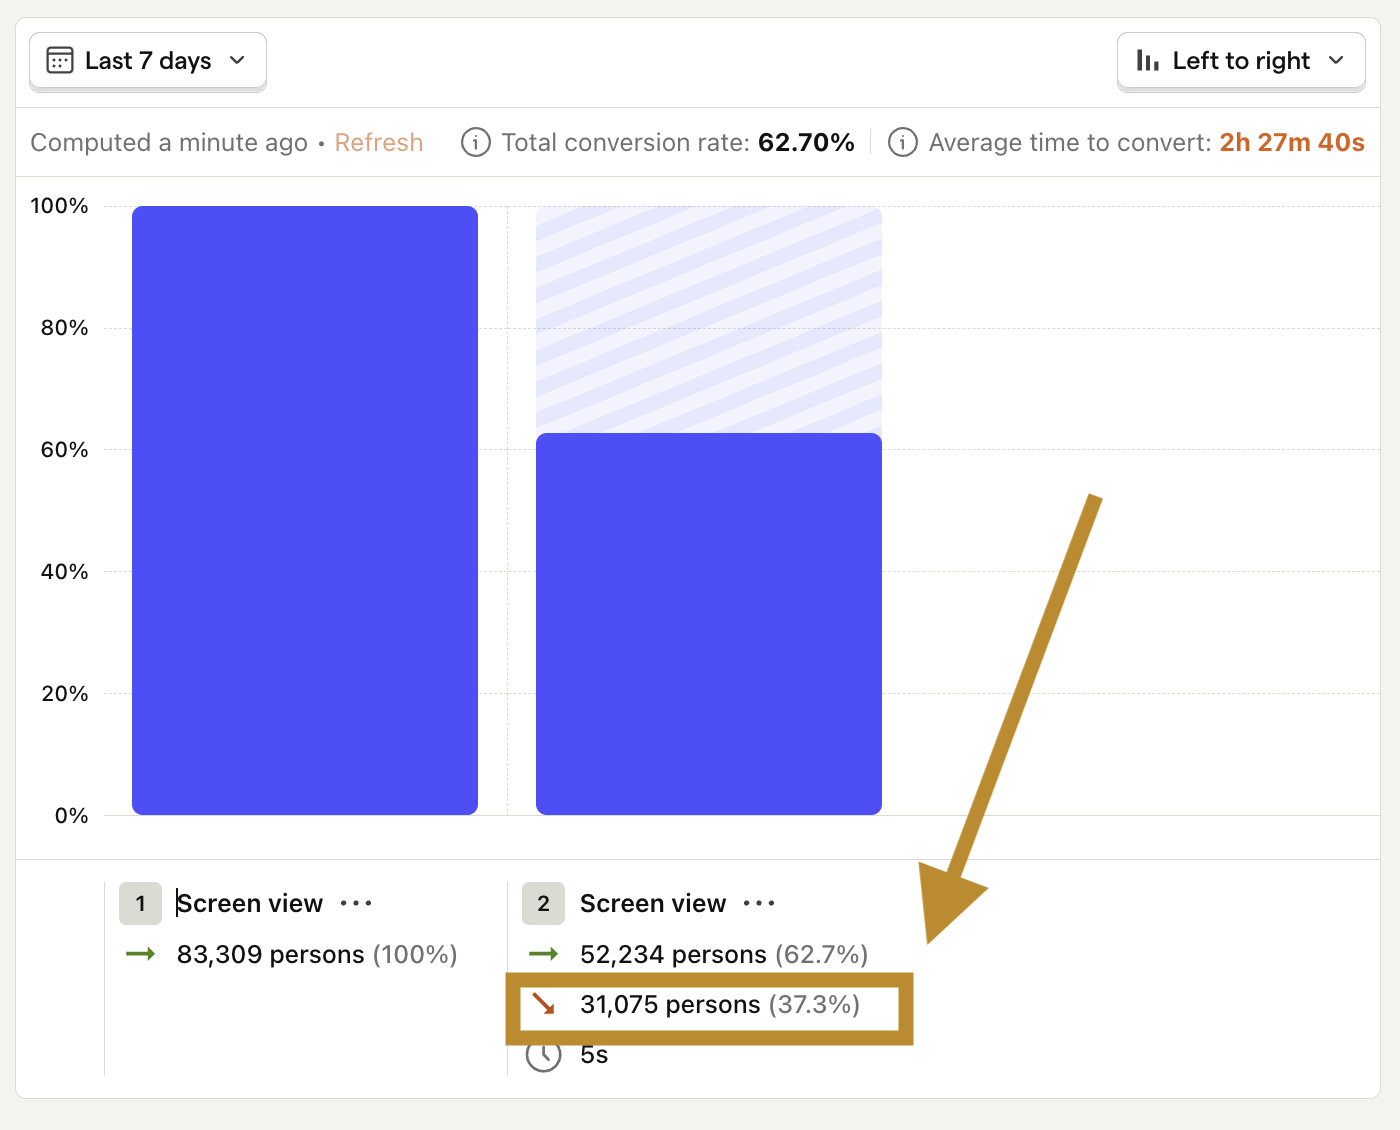
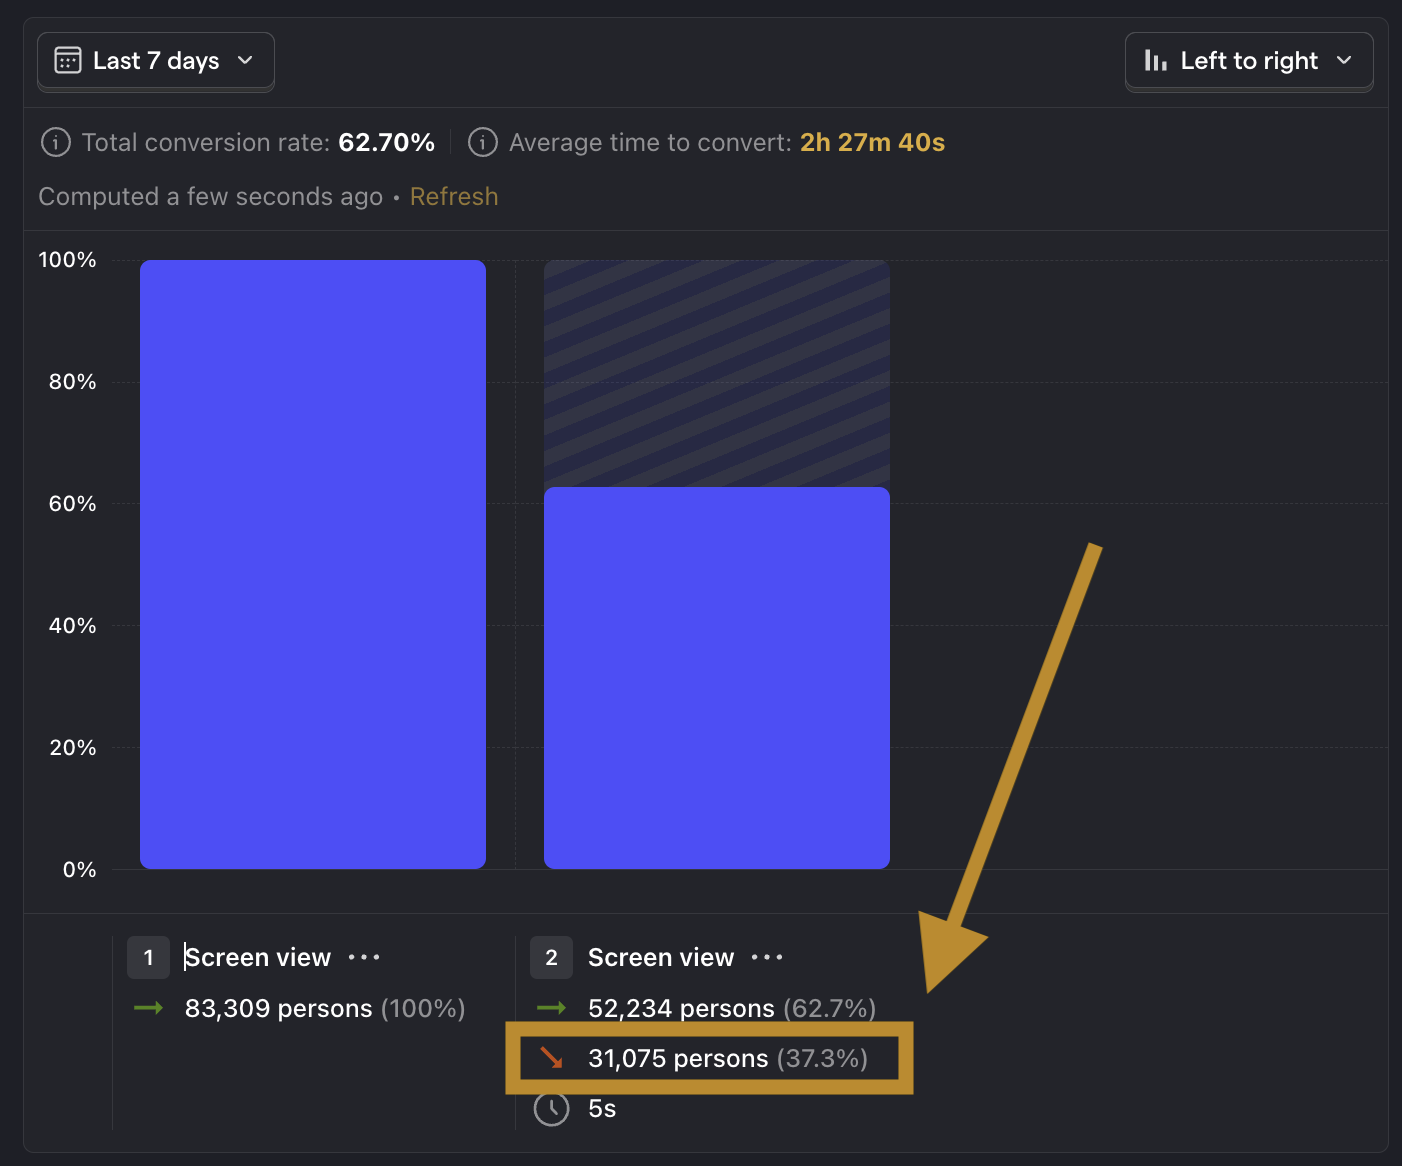
How to track it: Create a funnel with the Home screen view as the first step. Add a Screen view event as the second step (you don't need to specify which screen). The bounce rate is the percentage of people who didn't view a second screen.
2. Permissions granted rate
What is it? The percentage of users who grant the necessary permissions to use your app.
Why is it useful? Indicates if users are comfortable with your app and the permissions it's requesting.
Good benchmark: While there are no publicly available benchmarks, between 60-80% is considered good.
Questions to ask:
- Which permissions are most commonly granted, and which are least likely to be granted?
- How does the number correlate with user activation and retention?
- Which types of users ar more likely to trust your app and grant permissions?
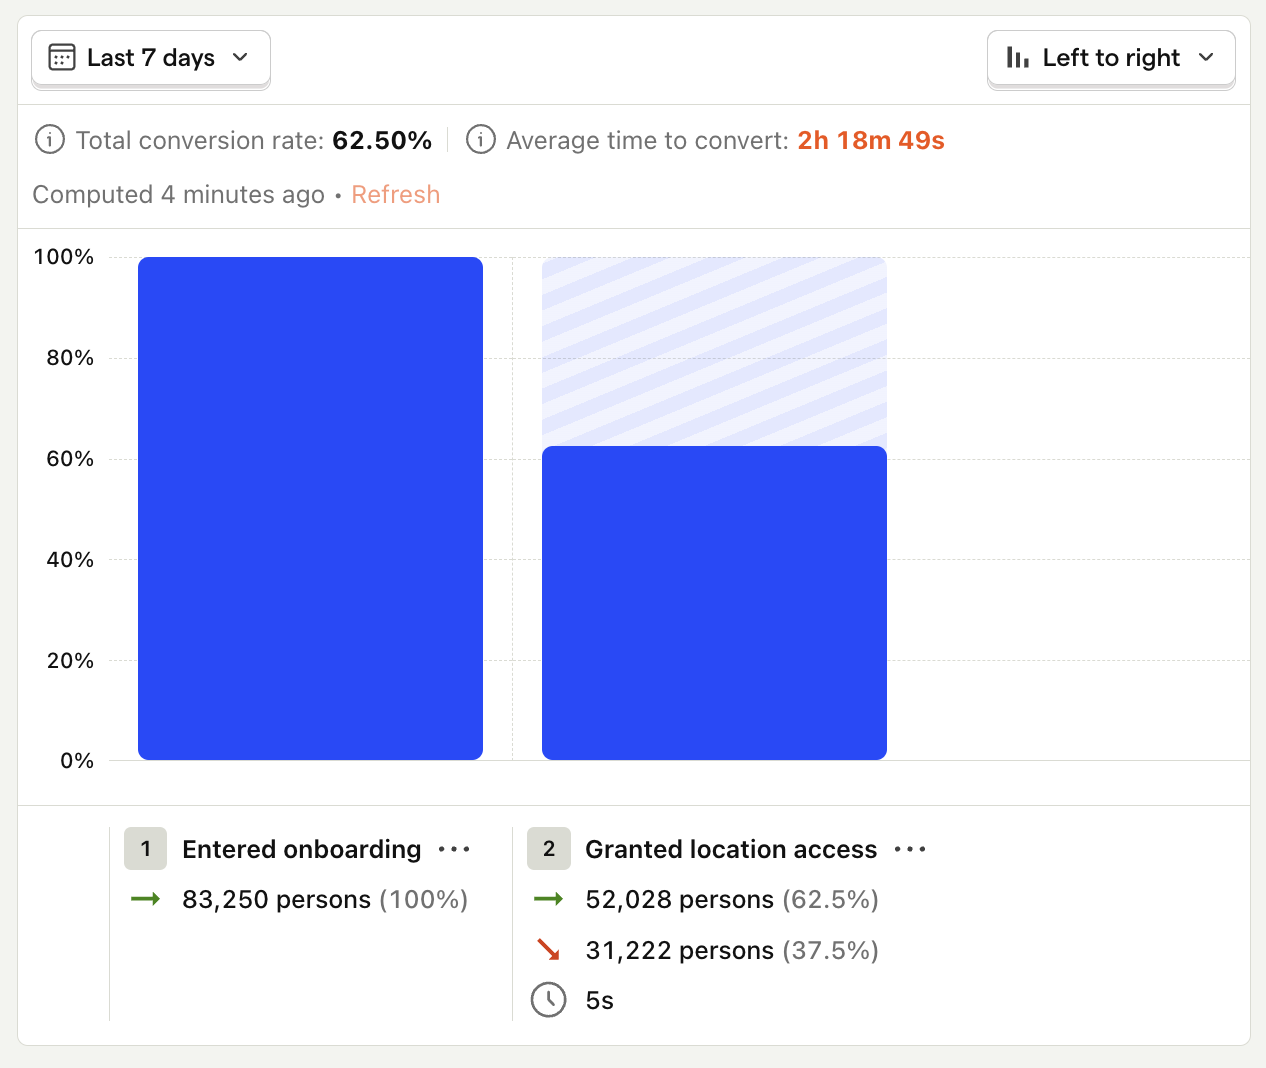
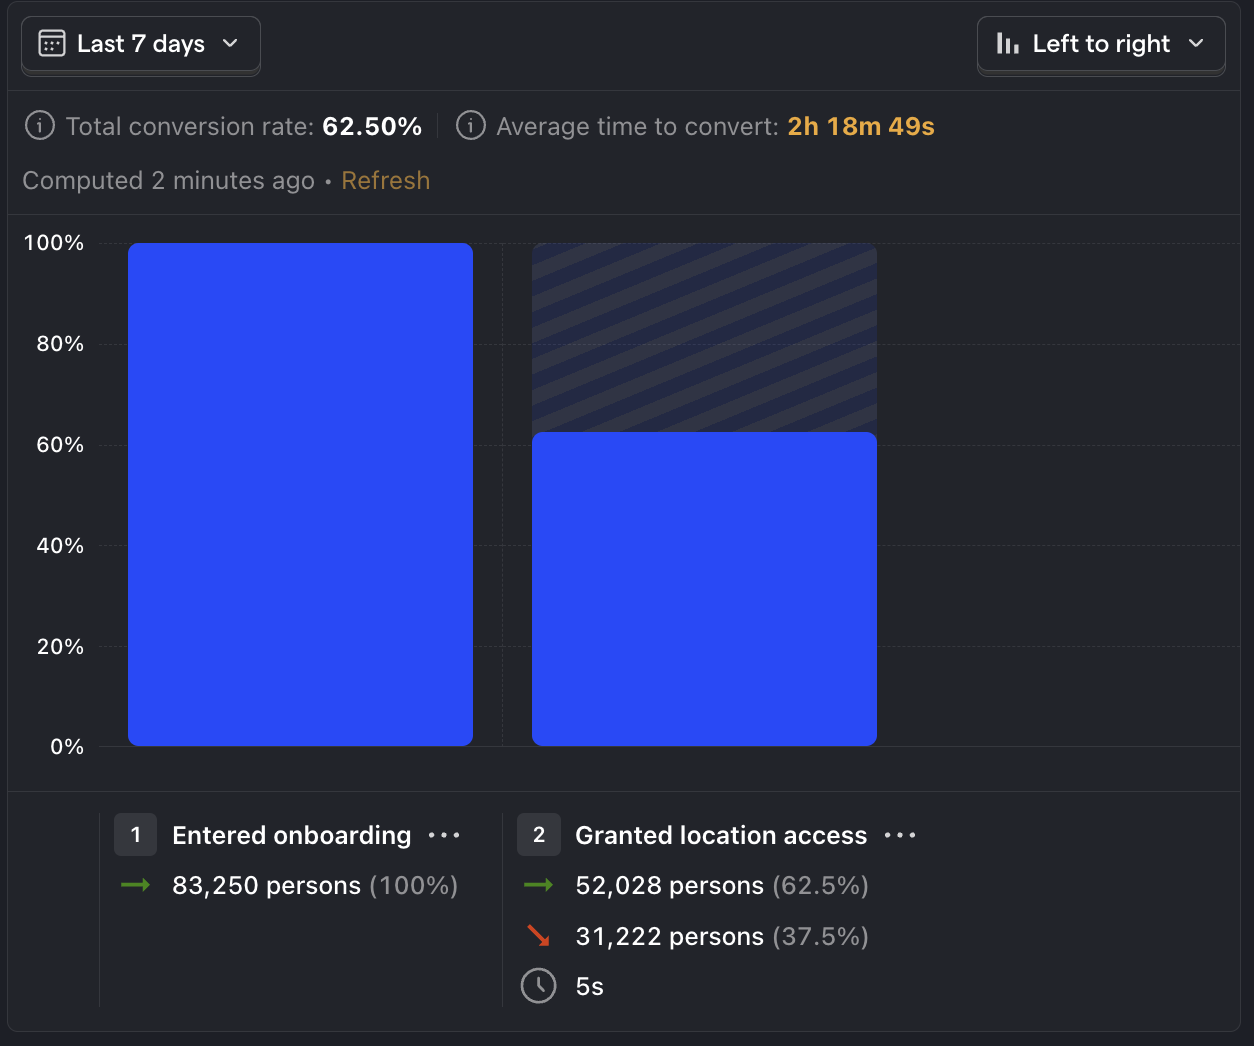
How to track it: Capture an event when the permissions modal is shown and when the user responds. Create a funnel with these events to view the permissions granted rate.
3. App downloads
What is it? The number of times your app has been downloaded.
Why is it useful? Provides a baseline metric for user acquisition and helps measure the effectiveness of marketing campaigns.
Questions to ask:
- How does the number of downloads vary across different platforms (iOS, Android, etc.)?
- Is there a correlation between the number of downloads and user engagement or retention?
- How do different marketing channels impact the number of downloads?
How to track it: Retrieve your app downloads data from the App Store and Play Store. Capture an event in PostHog for each download and track it using a trend. Breakdown by Device Type or OS to see the distribution by platform.
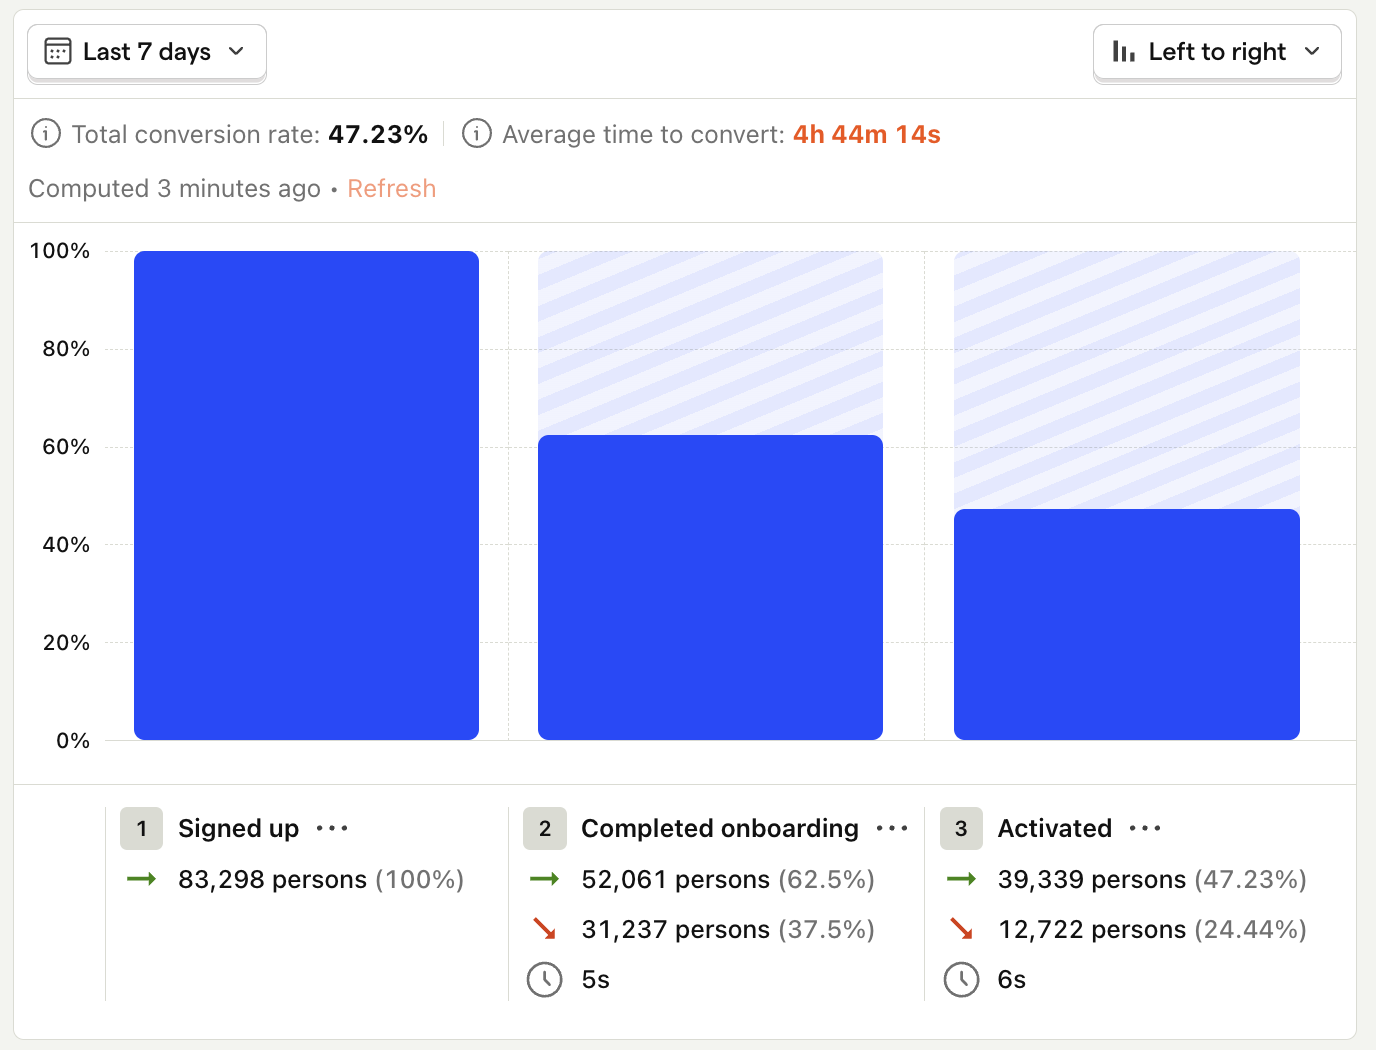
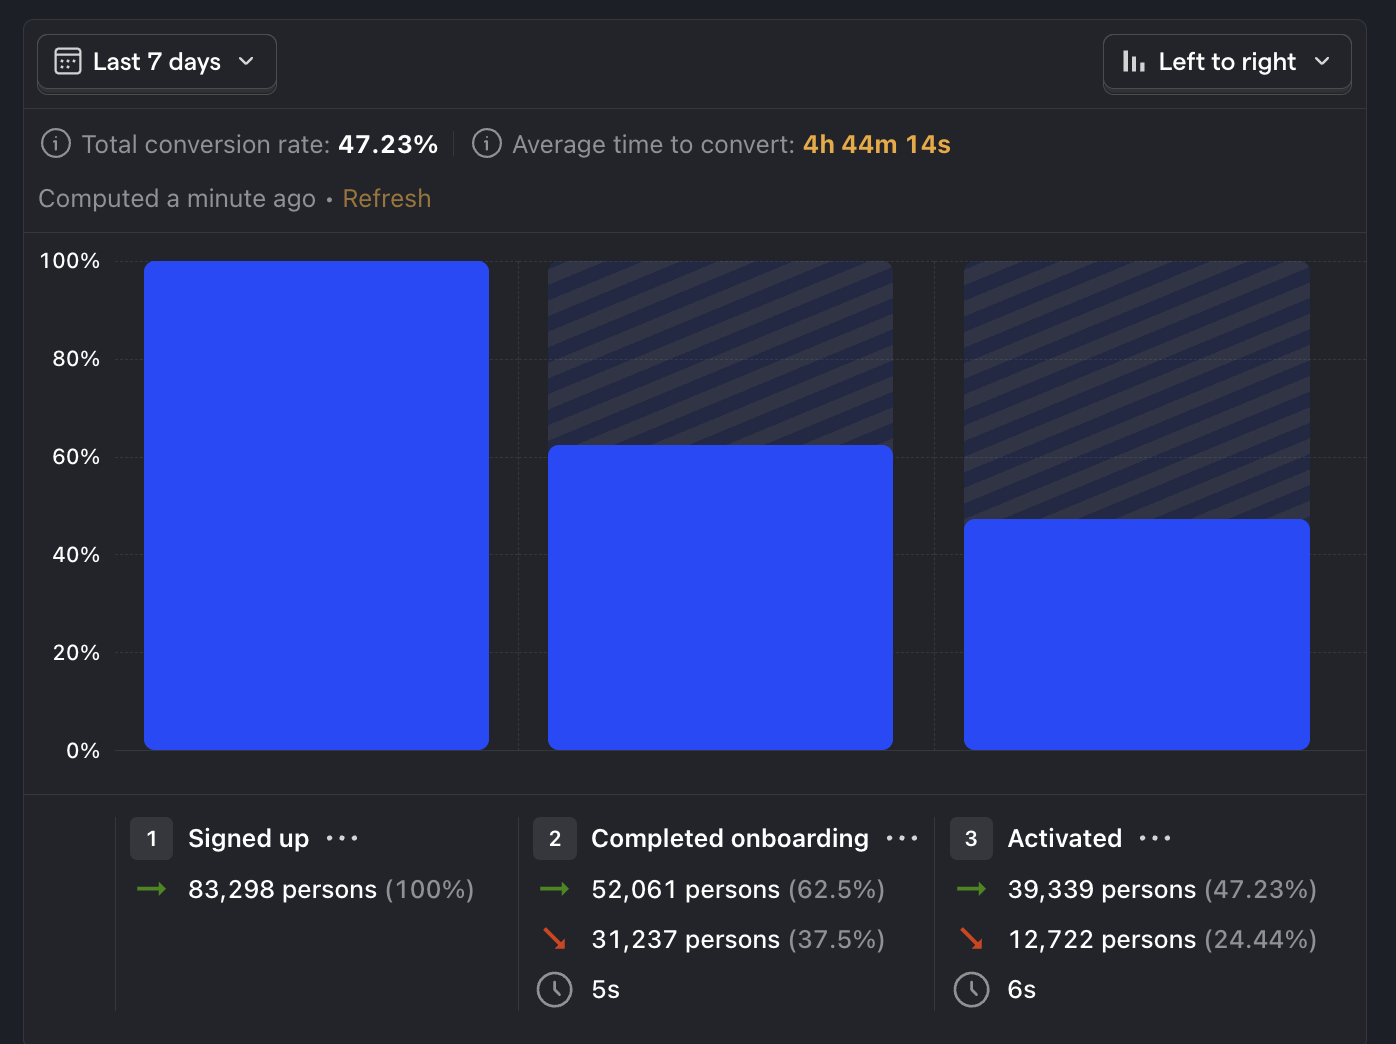
4. Activation rate
What is it? The percentage of users who reach the "aha" moment and experience your app's core value.
Why is it useful? Measures how effective your app's onboarding and messaging is.
Good benchmark: Above 8%2
Questions to ask:
- Where are the largest drop-offs in the onboarding funnel before activation?
- How does activation correlate with retention and customer lifetime value?
- How do other external factors like marketing or app performance impact activation?
How to track it: Create a funnel starting from when the user sign up until when they complete the activation.
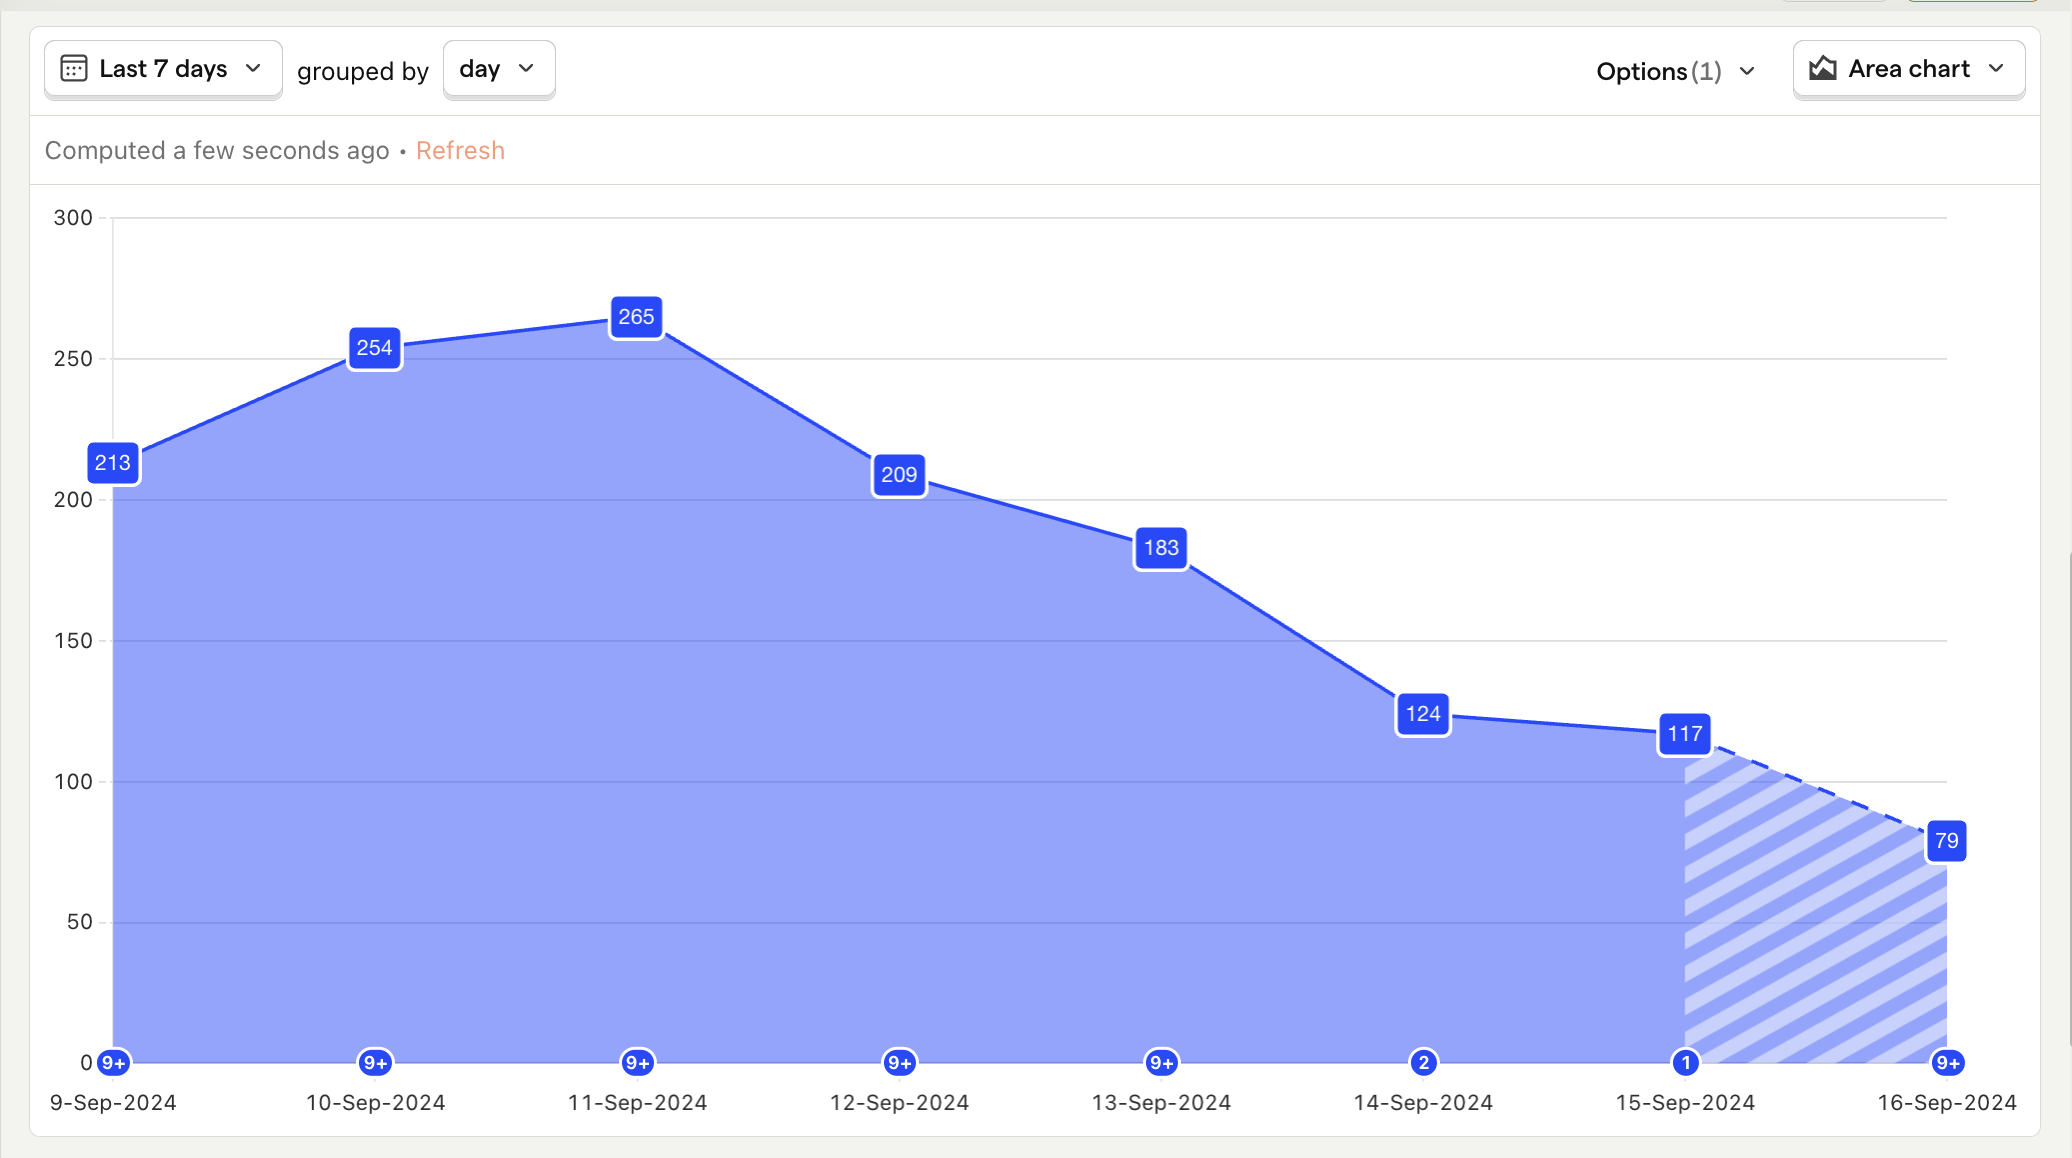
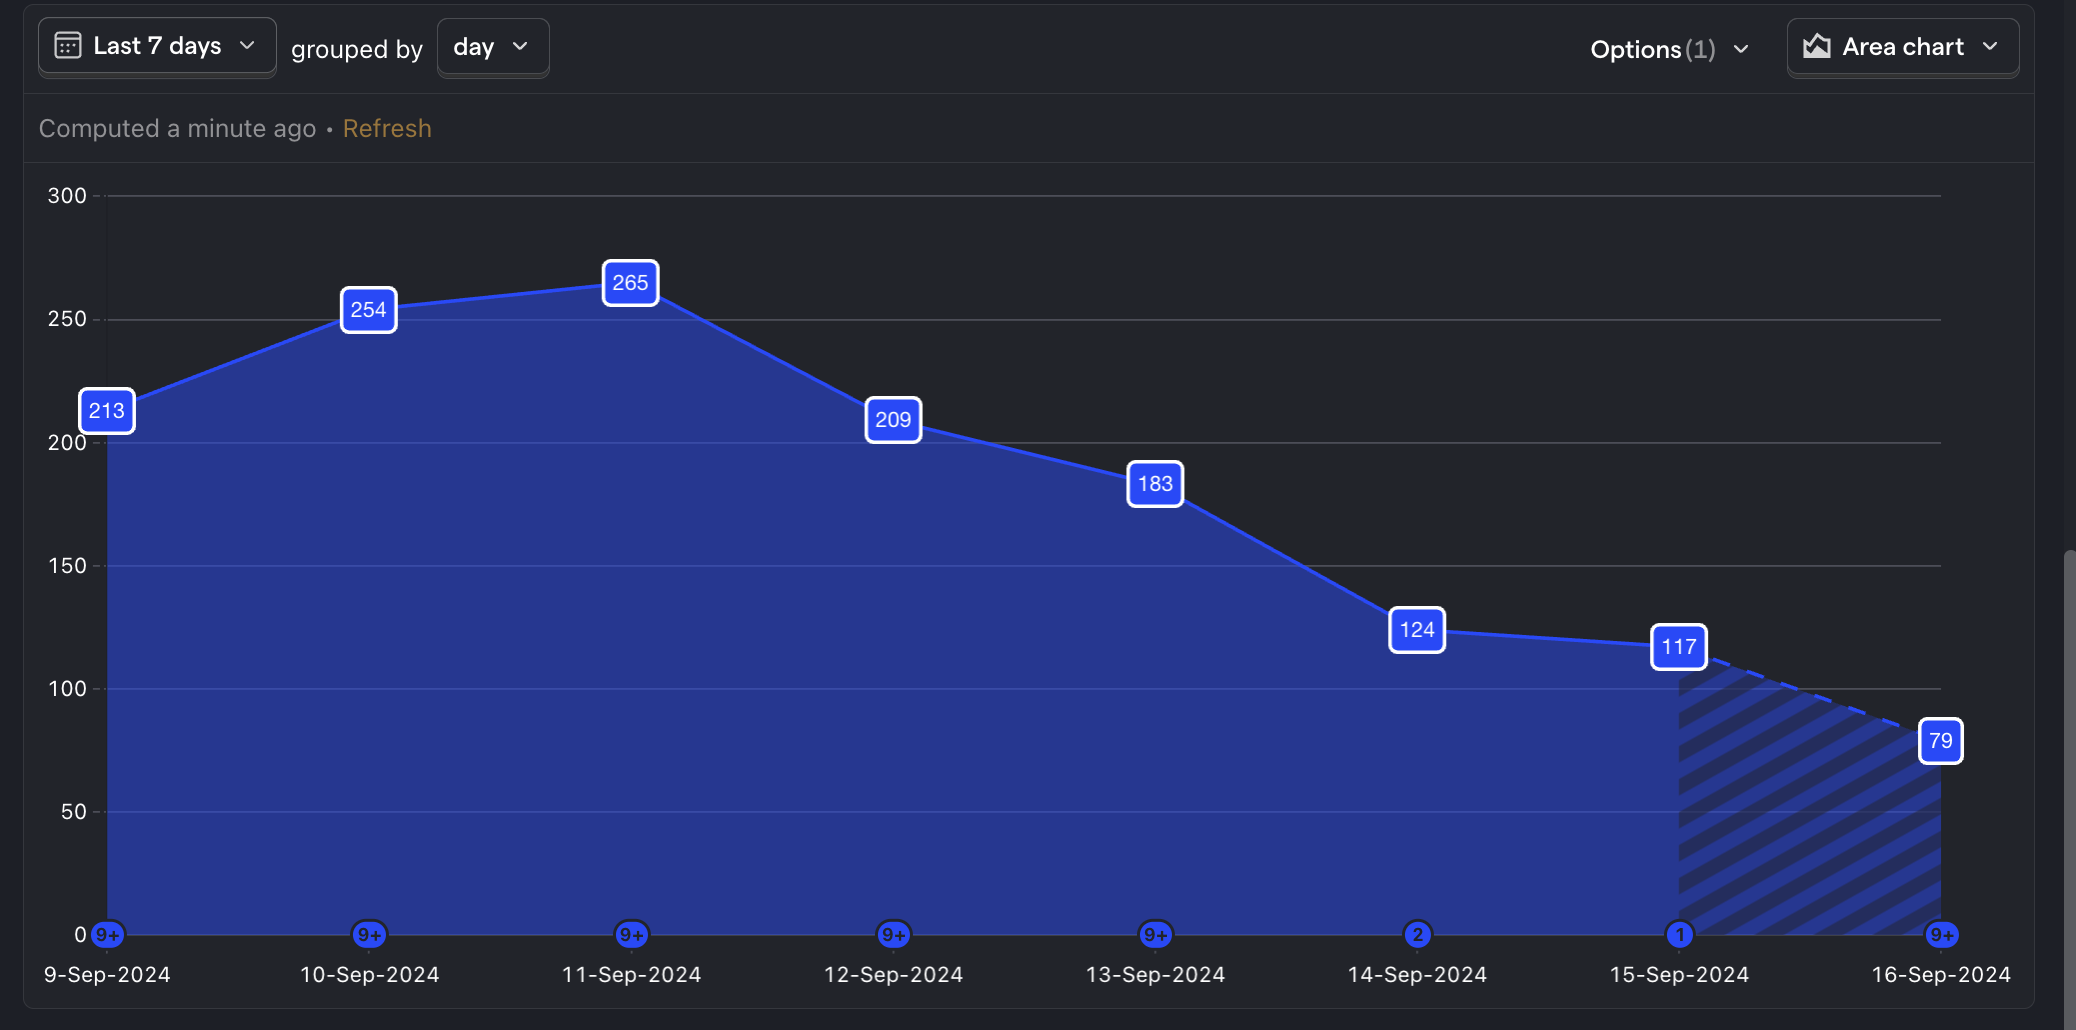
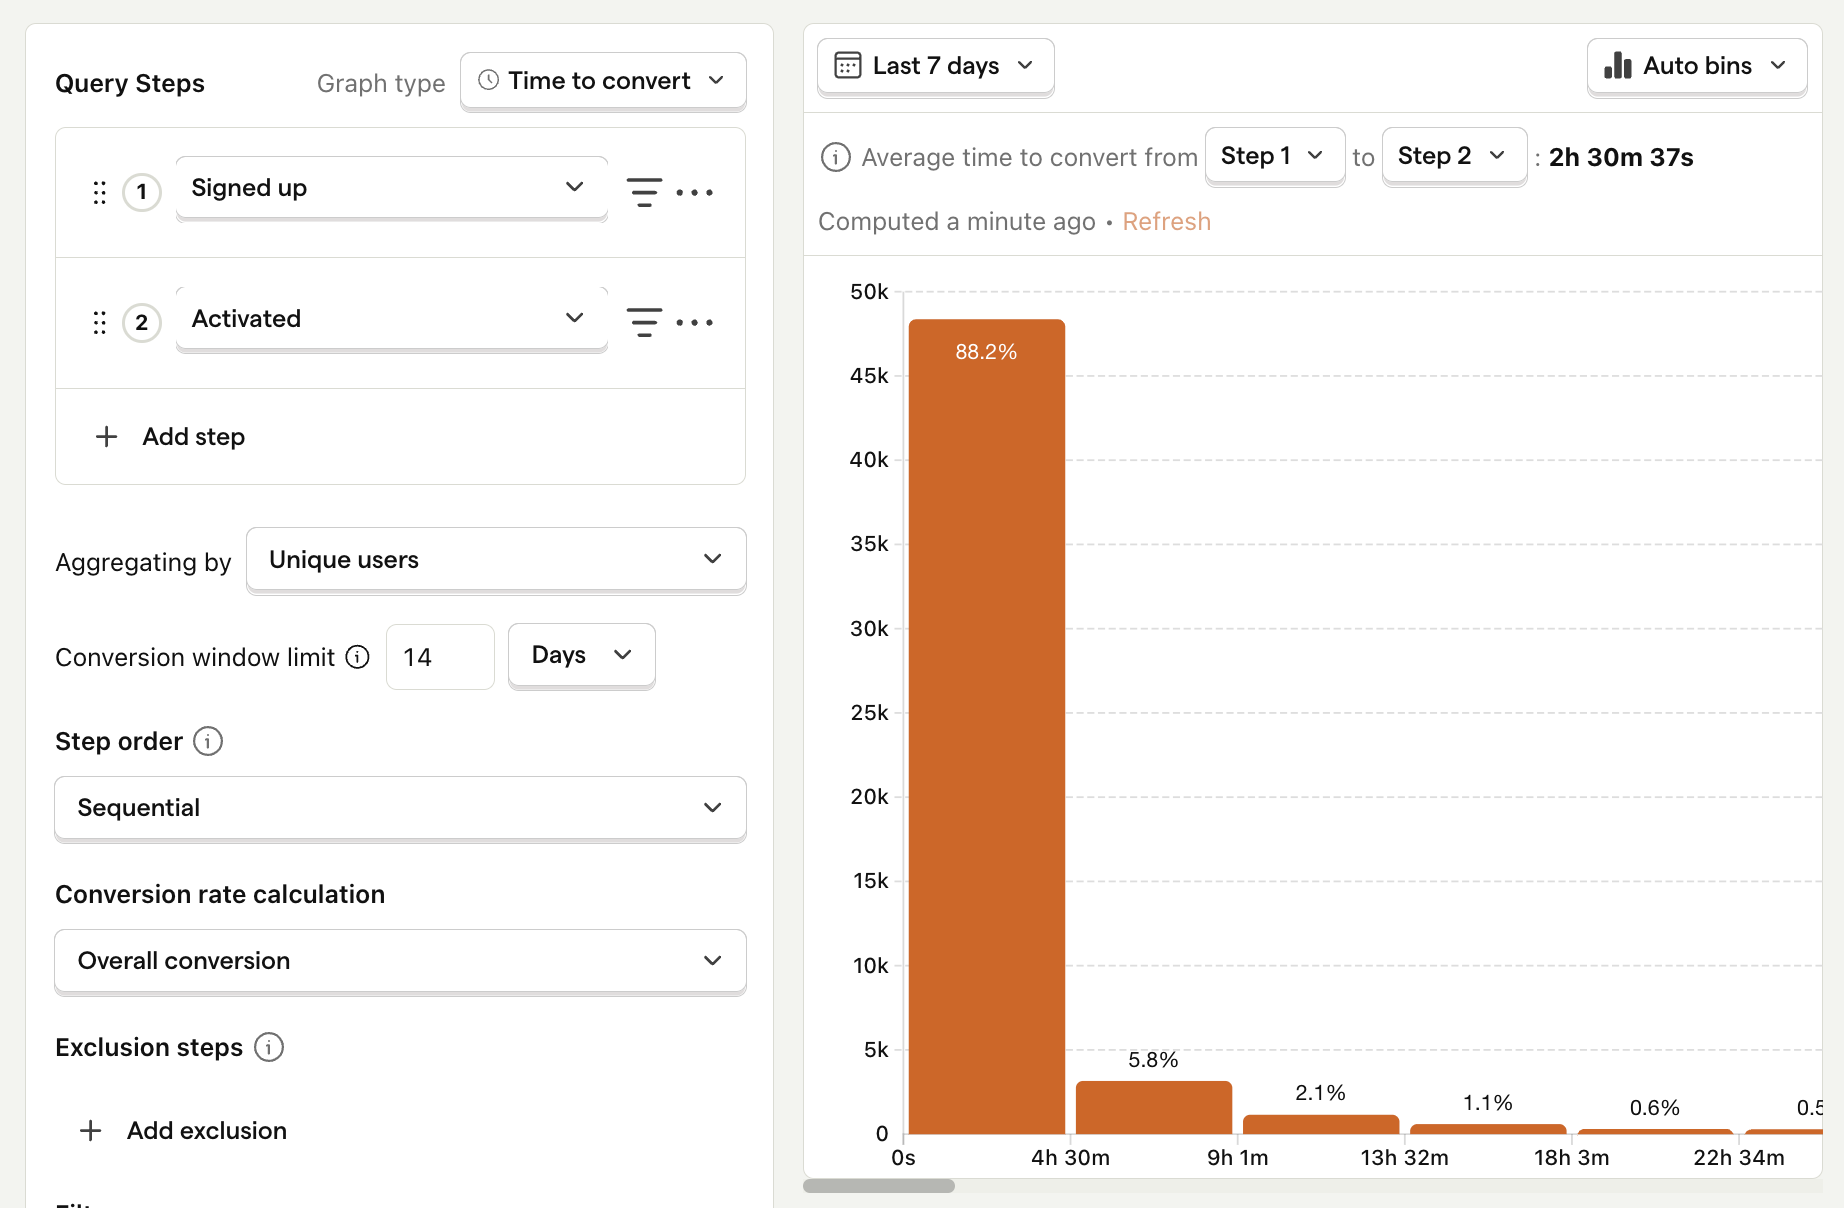
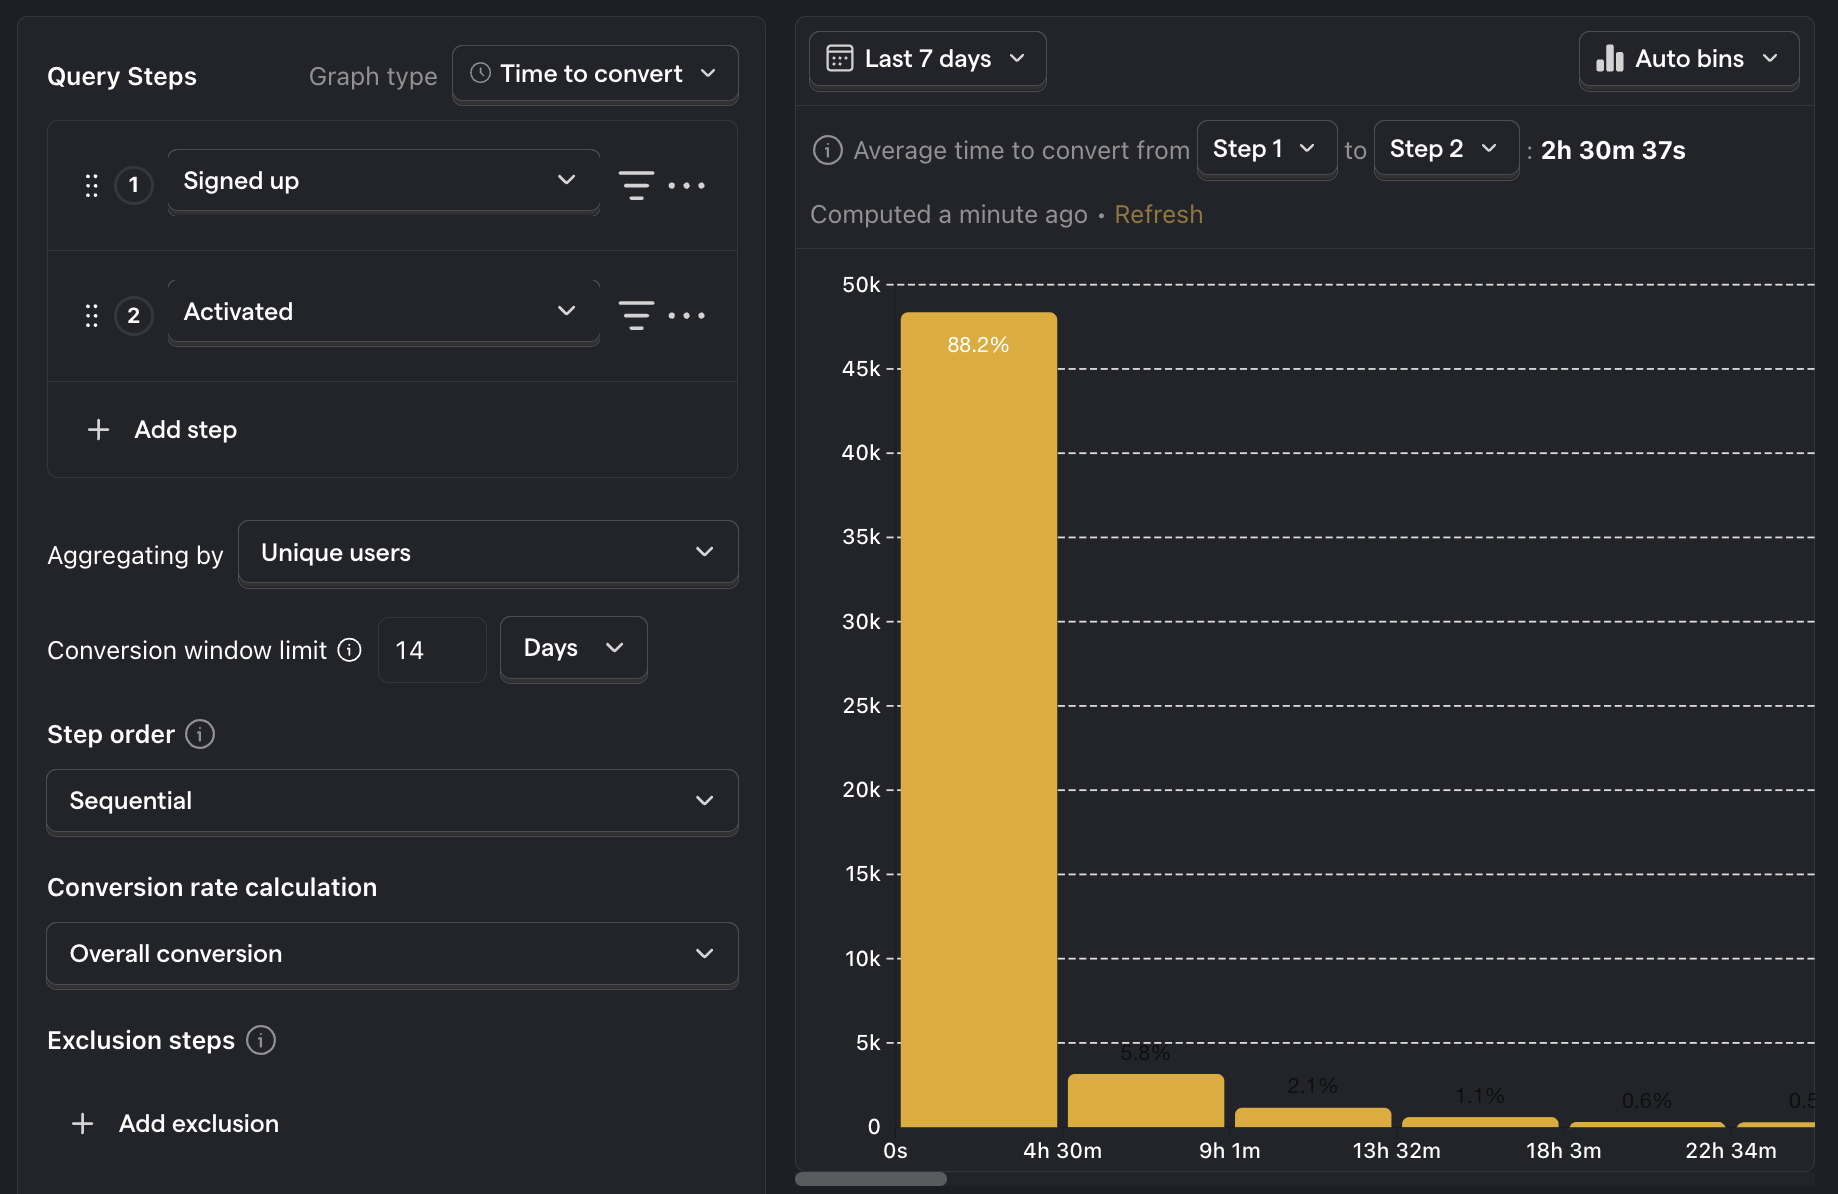
5. Average time to activation
What is it? The average time it takes for a user to reach activation.
Why is it useful? Gives you a sense of how long it takes for a user to get value from your app.
Good benchmark: Varies depending on the type of app.
Questions to ask:
- What are common characteristics of users who take shorter or longer to activate?
- Is there a correlation between the time to activation and churn?
- Is there a correlation between the speed of activation and long-term user retention?
How to track it: Create a funnel with your signup and activation events. Set the graph type to Time to convert.
App engagement metrics
6. App and feature stickiness
What is it? The number of users who open your app and/or performed a specific action repeatedly over a given time period.
Why is it useful? Shows you if your app has successfully created a habit among your users.
Good benchmark Varies depending on the type of app.
Questions to ask:
- What percentage of users have interacted with a specific feature at least 3 times in the last 7 days?
- What are the characteristics of the users who adopt new features versus those who don't?
- How likely are users who try out a new feature to continue using it?
How to track it: Create a stickiness insight and select the event you want to measure.
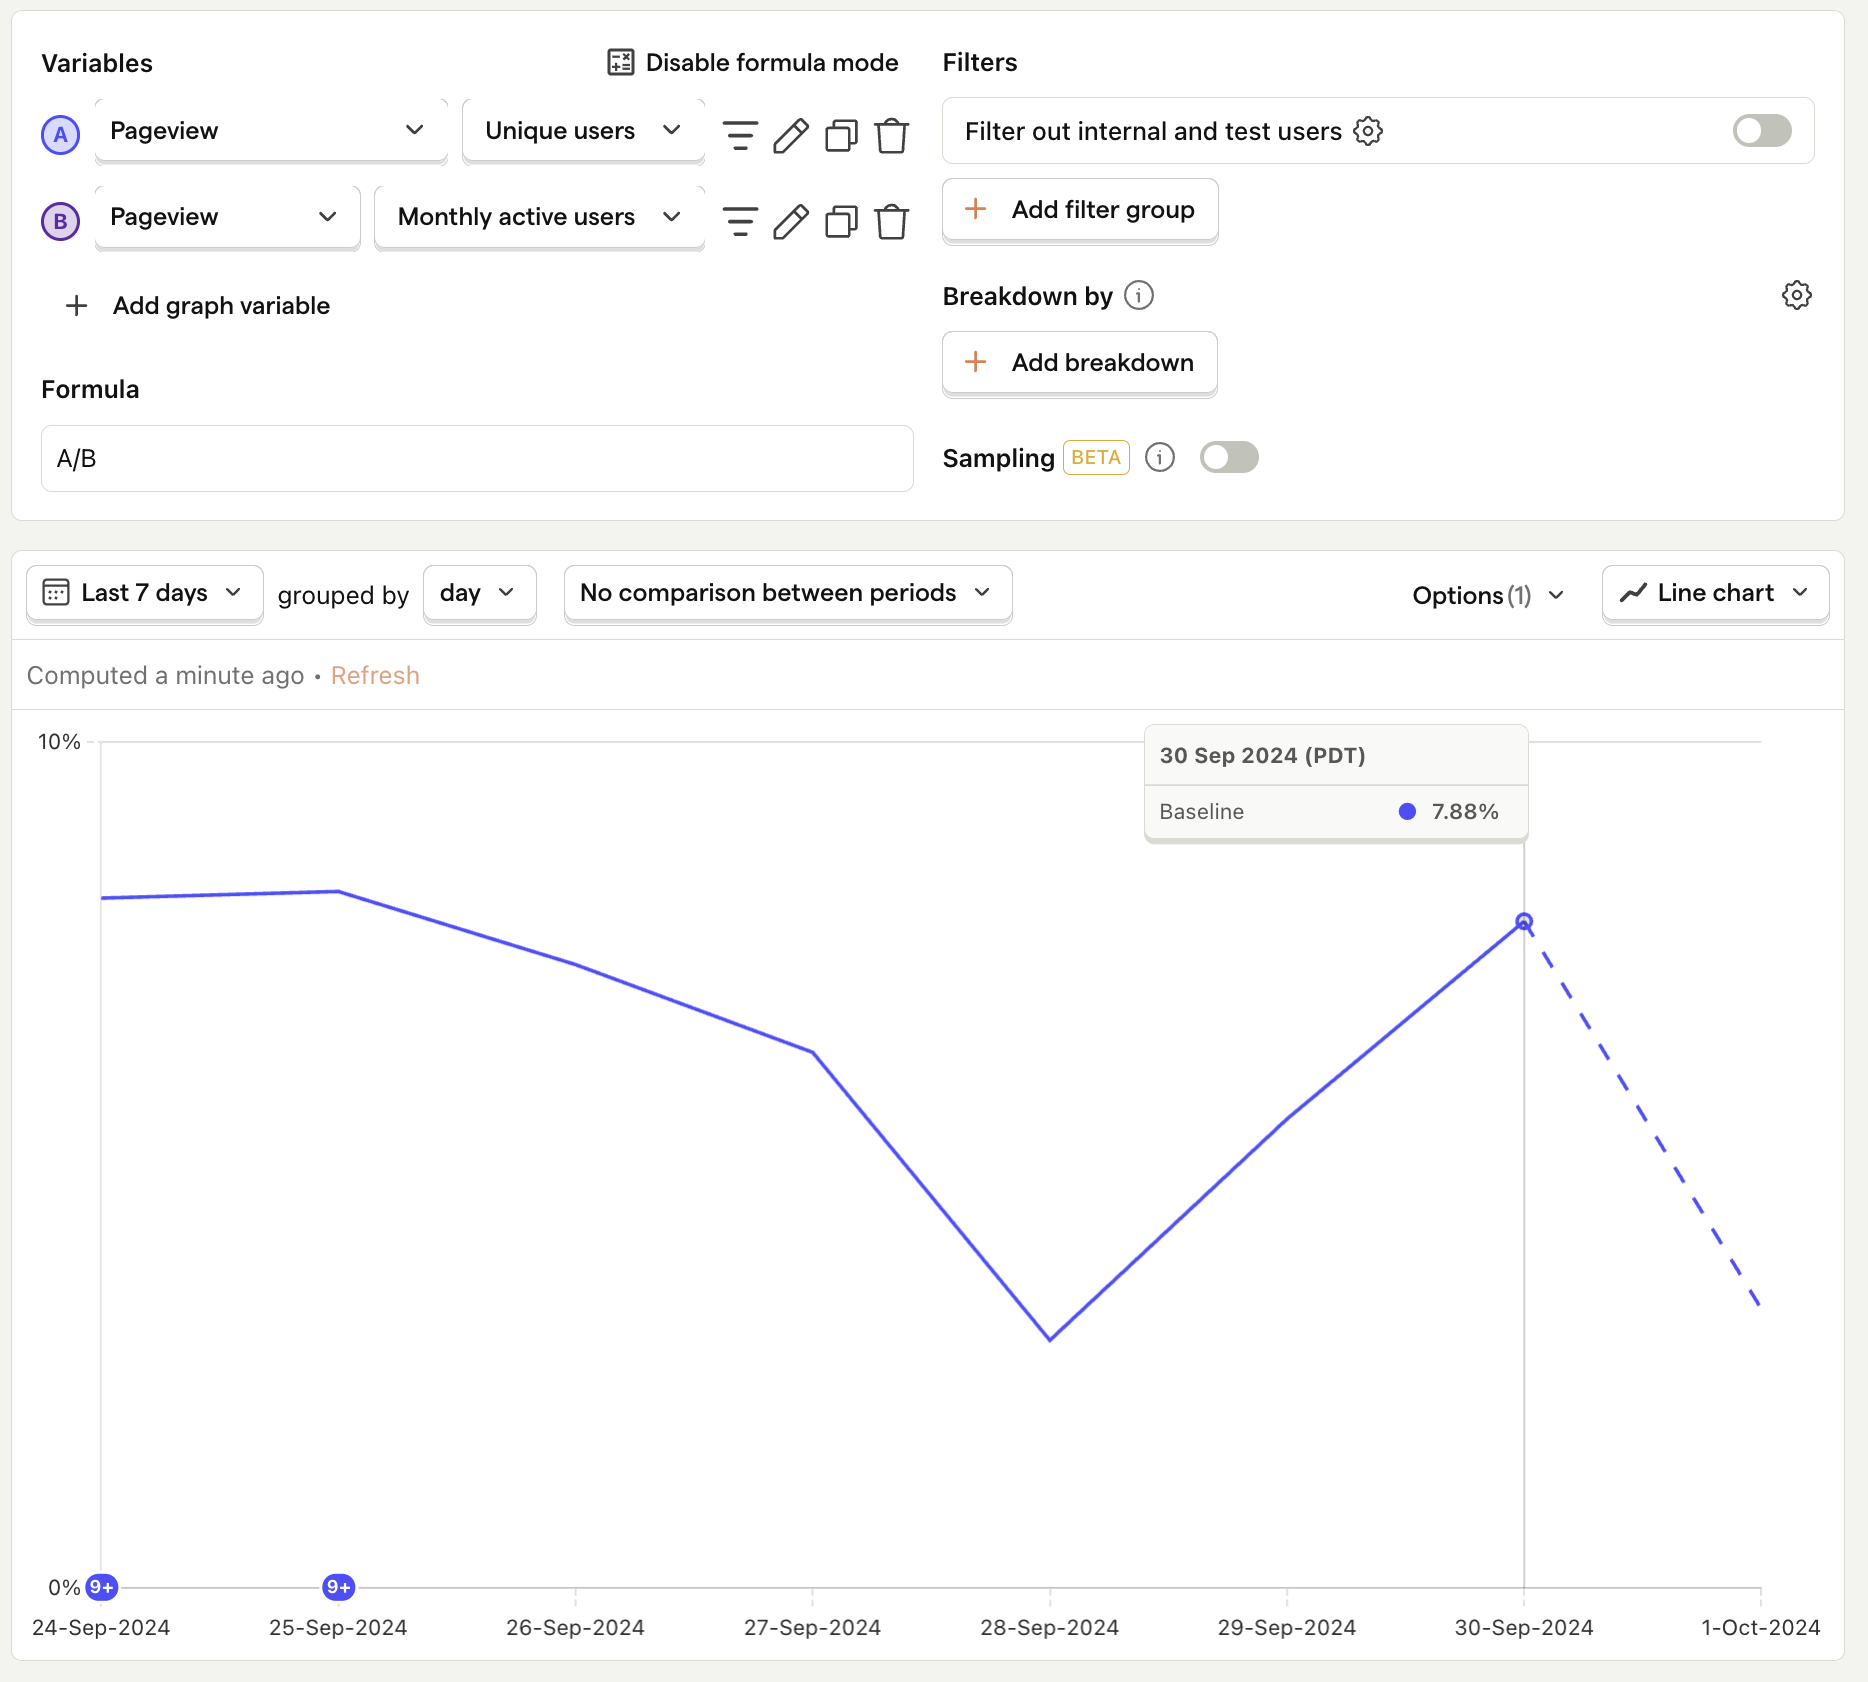
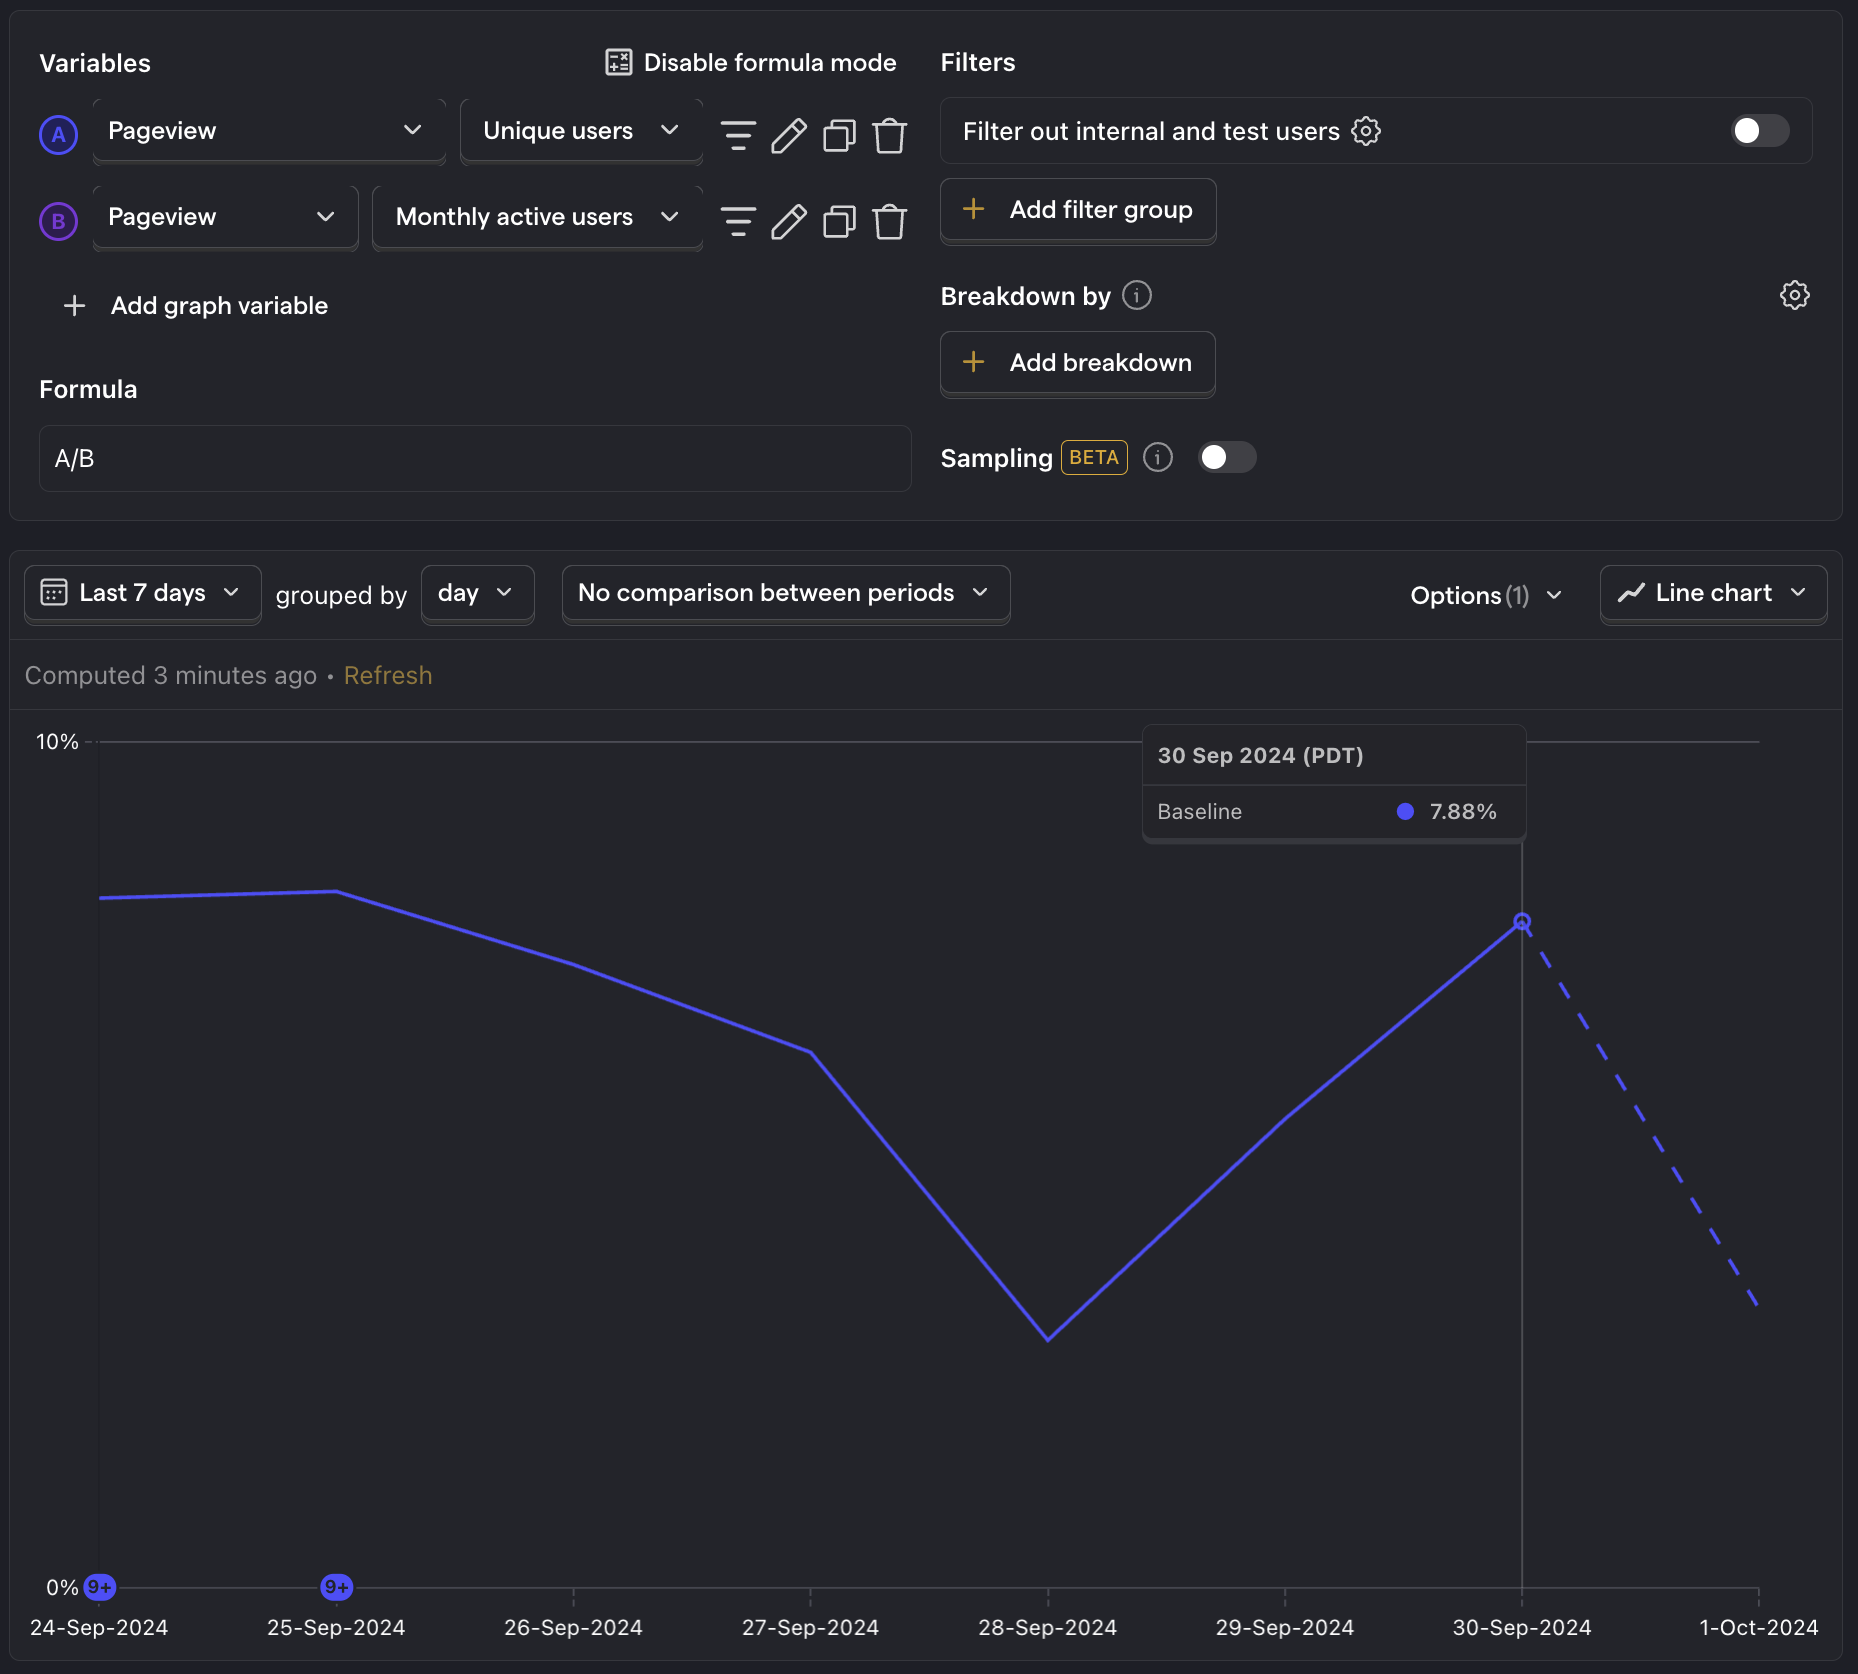
7. DAU / MAU ratio
What is it? The ratio of daily active users (DAU) to monthly active users (MAU).
Why is it useful? Highlights user loyalty and the app's ability to create daily habits.
Good benchmark: 20% is good and above 25% is considered great3
Questions to ask:
- How does this ratio change over time, and what factors might be influencing this trend?
- How does your DAU/MAU ratio compare to industry standards?
- Are users who are active daily more likely buy in-app purchases?
How to track it: Create a trend insight with formula mode. Using Pageview events, set your A-series to Unique users and B-series to Monthly active users. Then in the formula box type A / B.
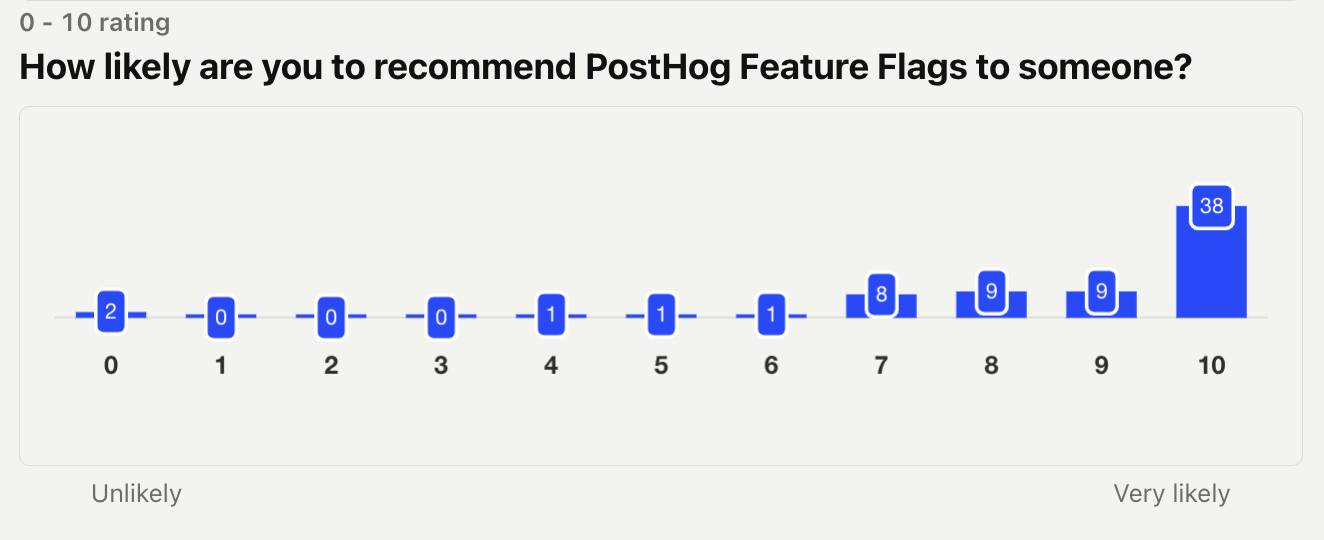
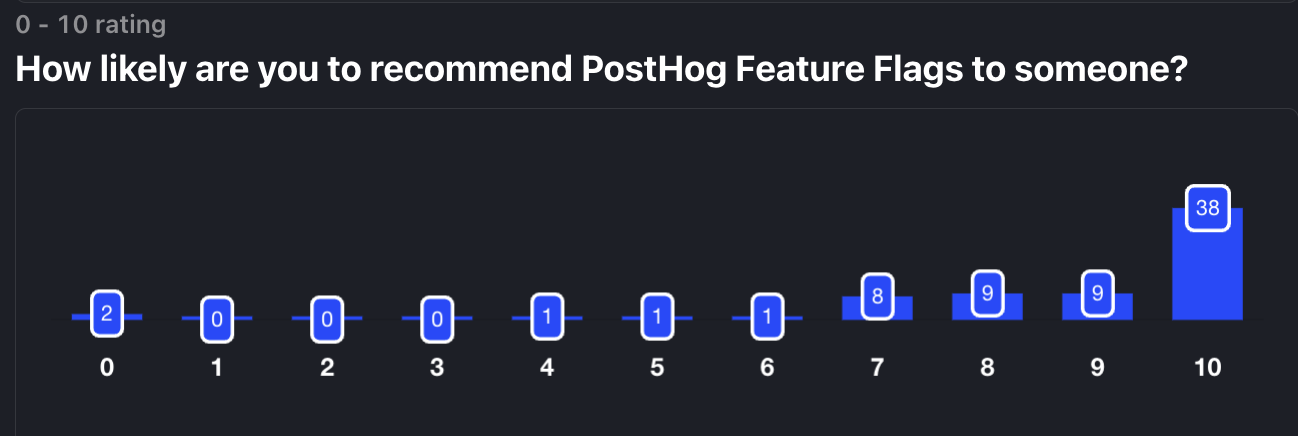
8. NPS score
What is it? Net Promoter Score (NPS) measures how passionate users are about your product. You ask them how likely they are to recommend your product to a friend or coworker and they respond on a scale from 0 (not likely at all) to 10 (extremely likely). Your score is the percentage of promoters (people who respond with 9 or 10) minus the percentage of detractors (people who respond with 0-6).
Why is it useful? NPS is a strong indicator of product-market fit. It's also a leading indicator of future revenue.
Good benchmark: Anything above 0 is good, above 20 is great, and above 50 is amazing4
Questions to ask:
- How does NPS score trend over time, especially after major updates or feature releases?
- What's the relationship between NPS scores and user retention rates at different time intervals (30, 60, 90 days)?
- Are there significant differences in NPS scores between users on different platforms (iOS vs Android) or subscription tiers?
How to track it: Create a custom survey in PostHog and capture survey events using the API. PostHog will then automatically calculate the NPS score for you.
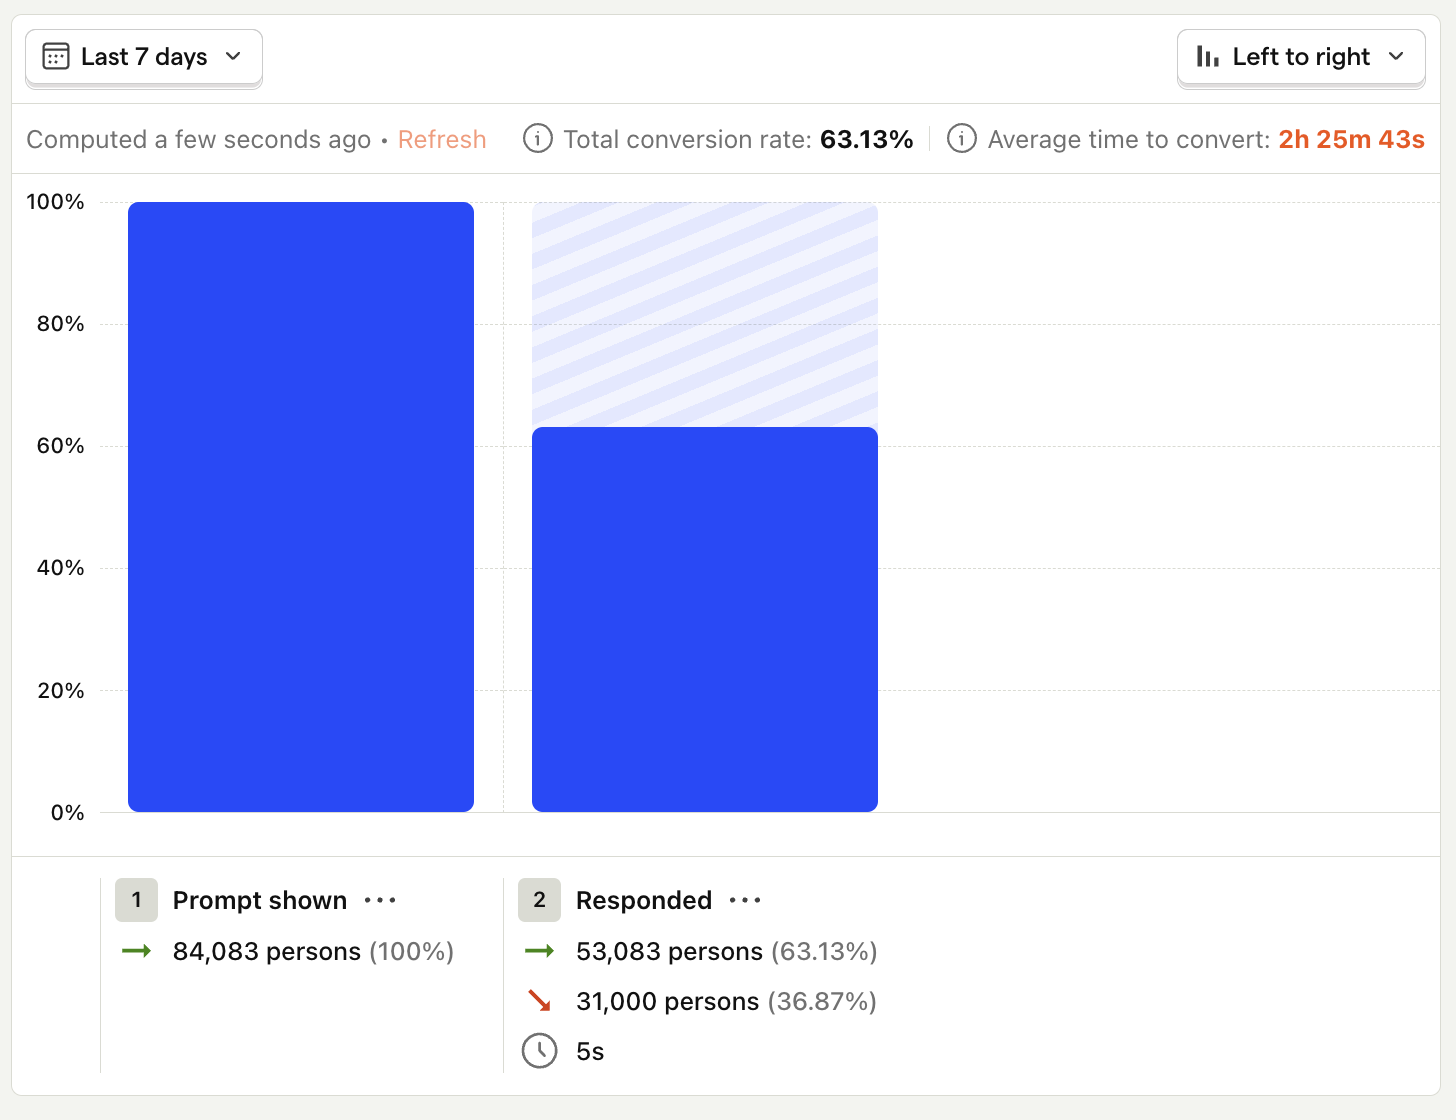
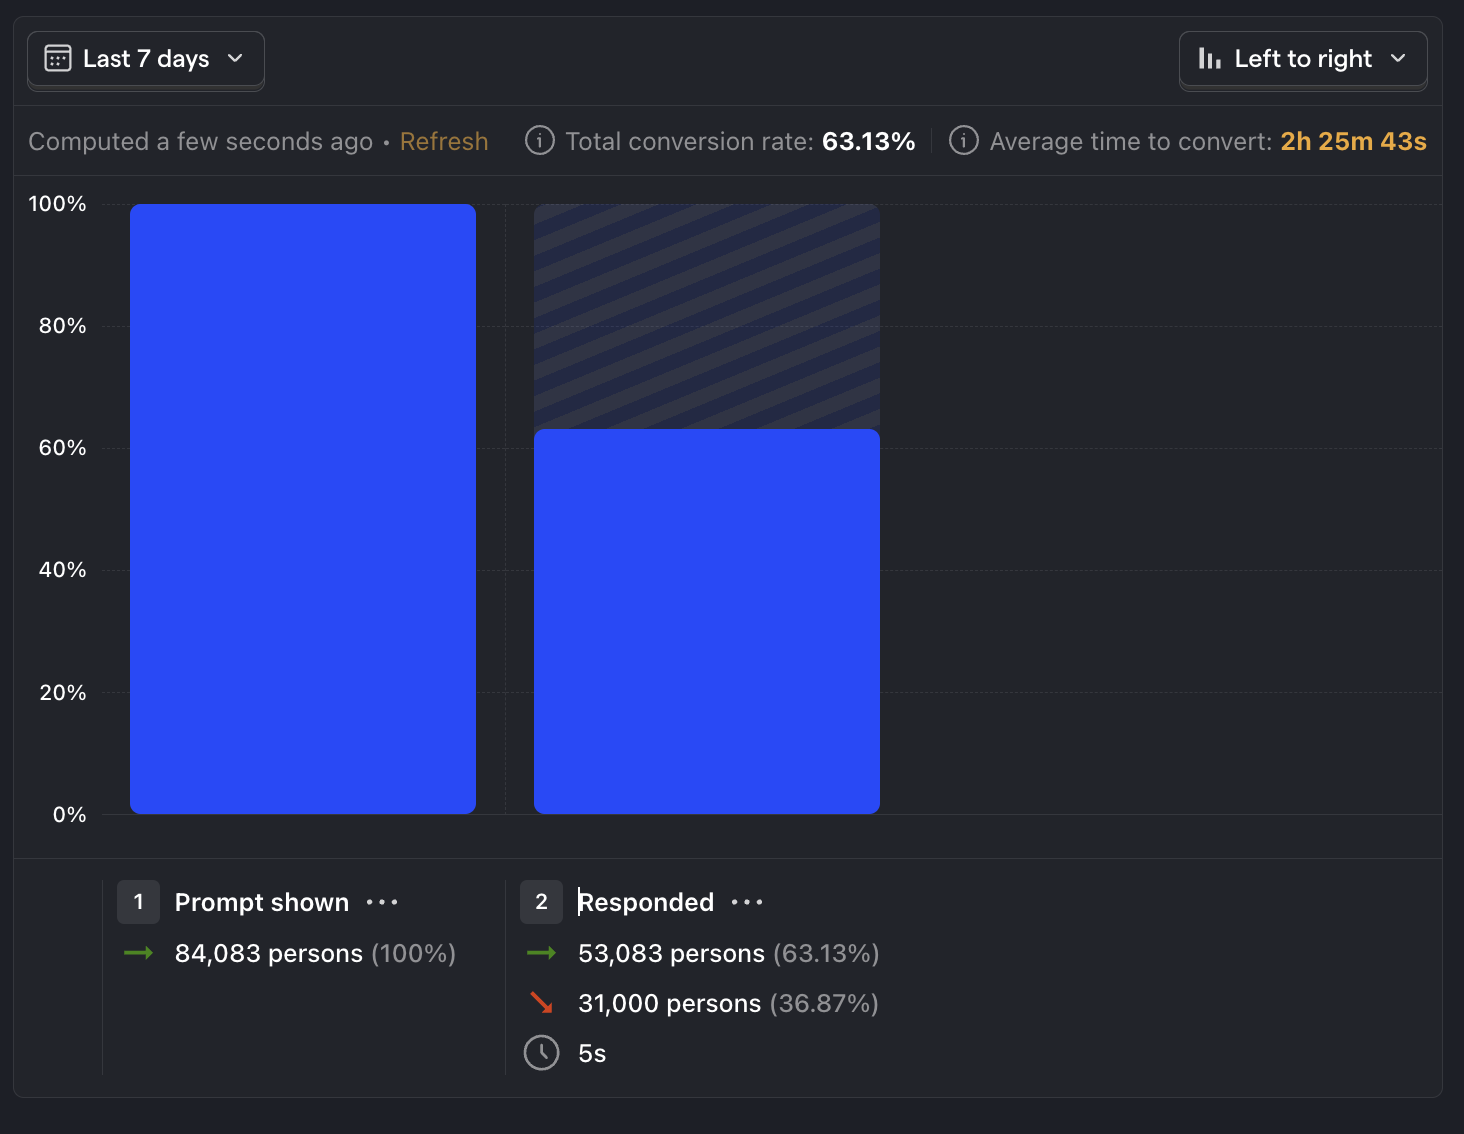
9. In-app response rate
What is it? The percentage of users who respond to your in-app messages, surveys, or review requests.
Why is it useful? Indicates how engaged and vested users are with using your app.
Good benchmark: 28% for in-app prompts, 13% for in-app surveys5
Question to ask:
- How does the timing and frequency of in-app prompts affect response rates?
- Is there a correlation between response rates and user satisfaction or retention?
- What is the optimal length for in-app surveys to maximize completion rates?
How to track it: Create a funnel with your signup and activation events.
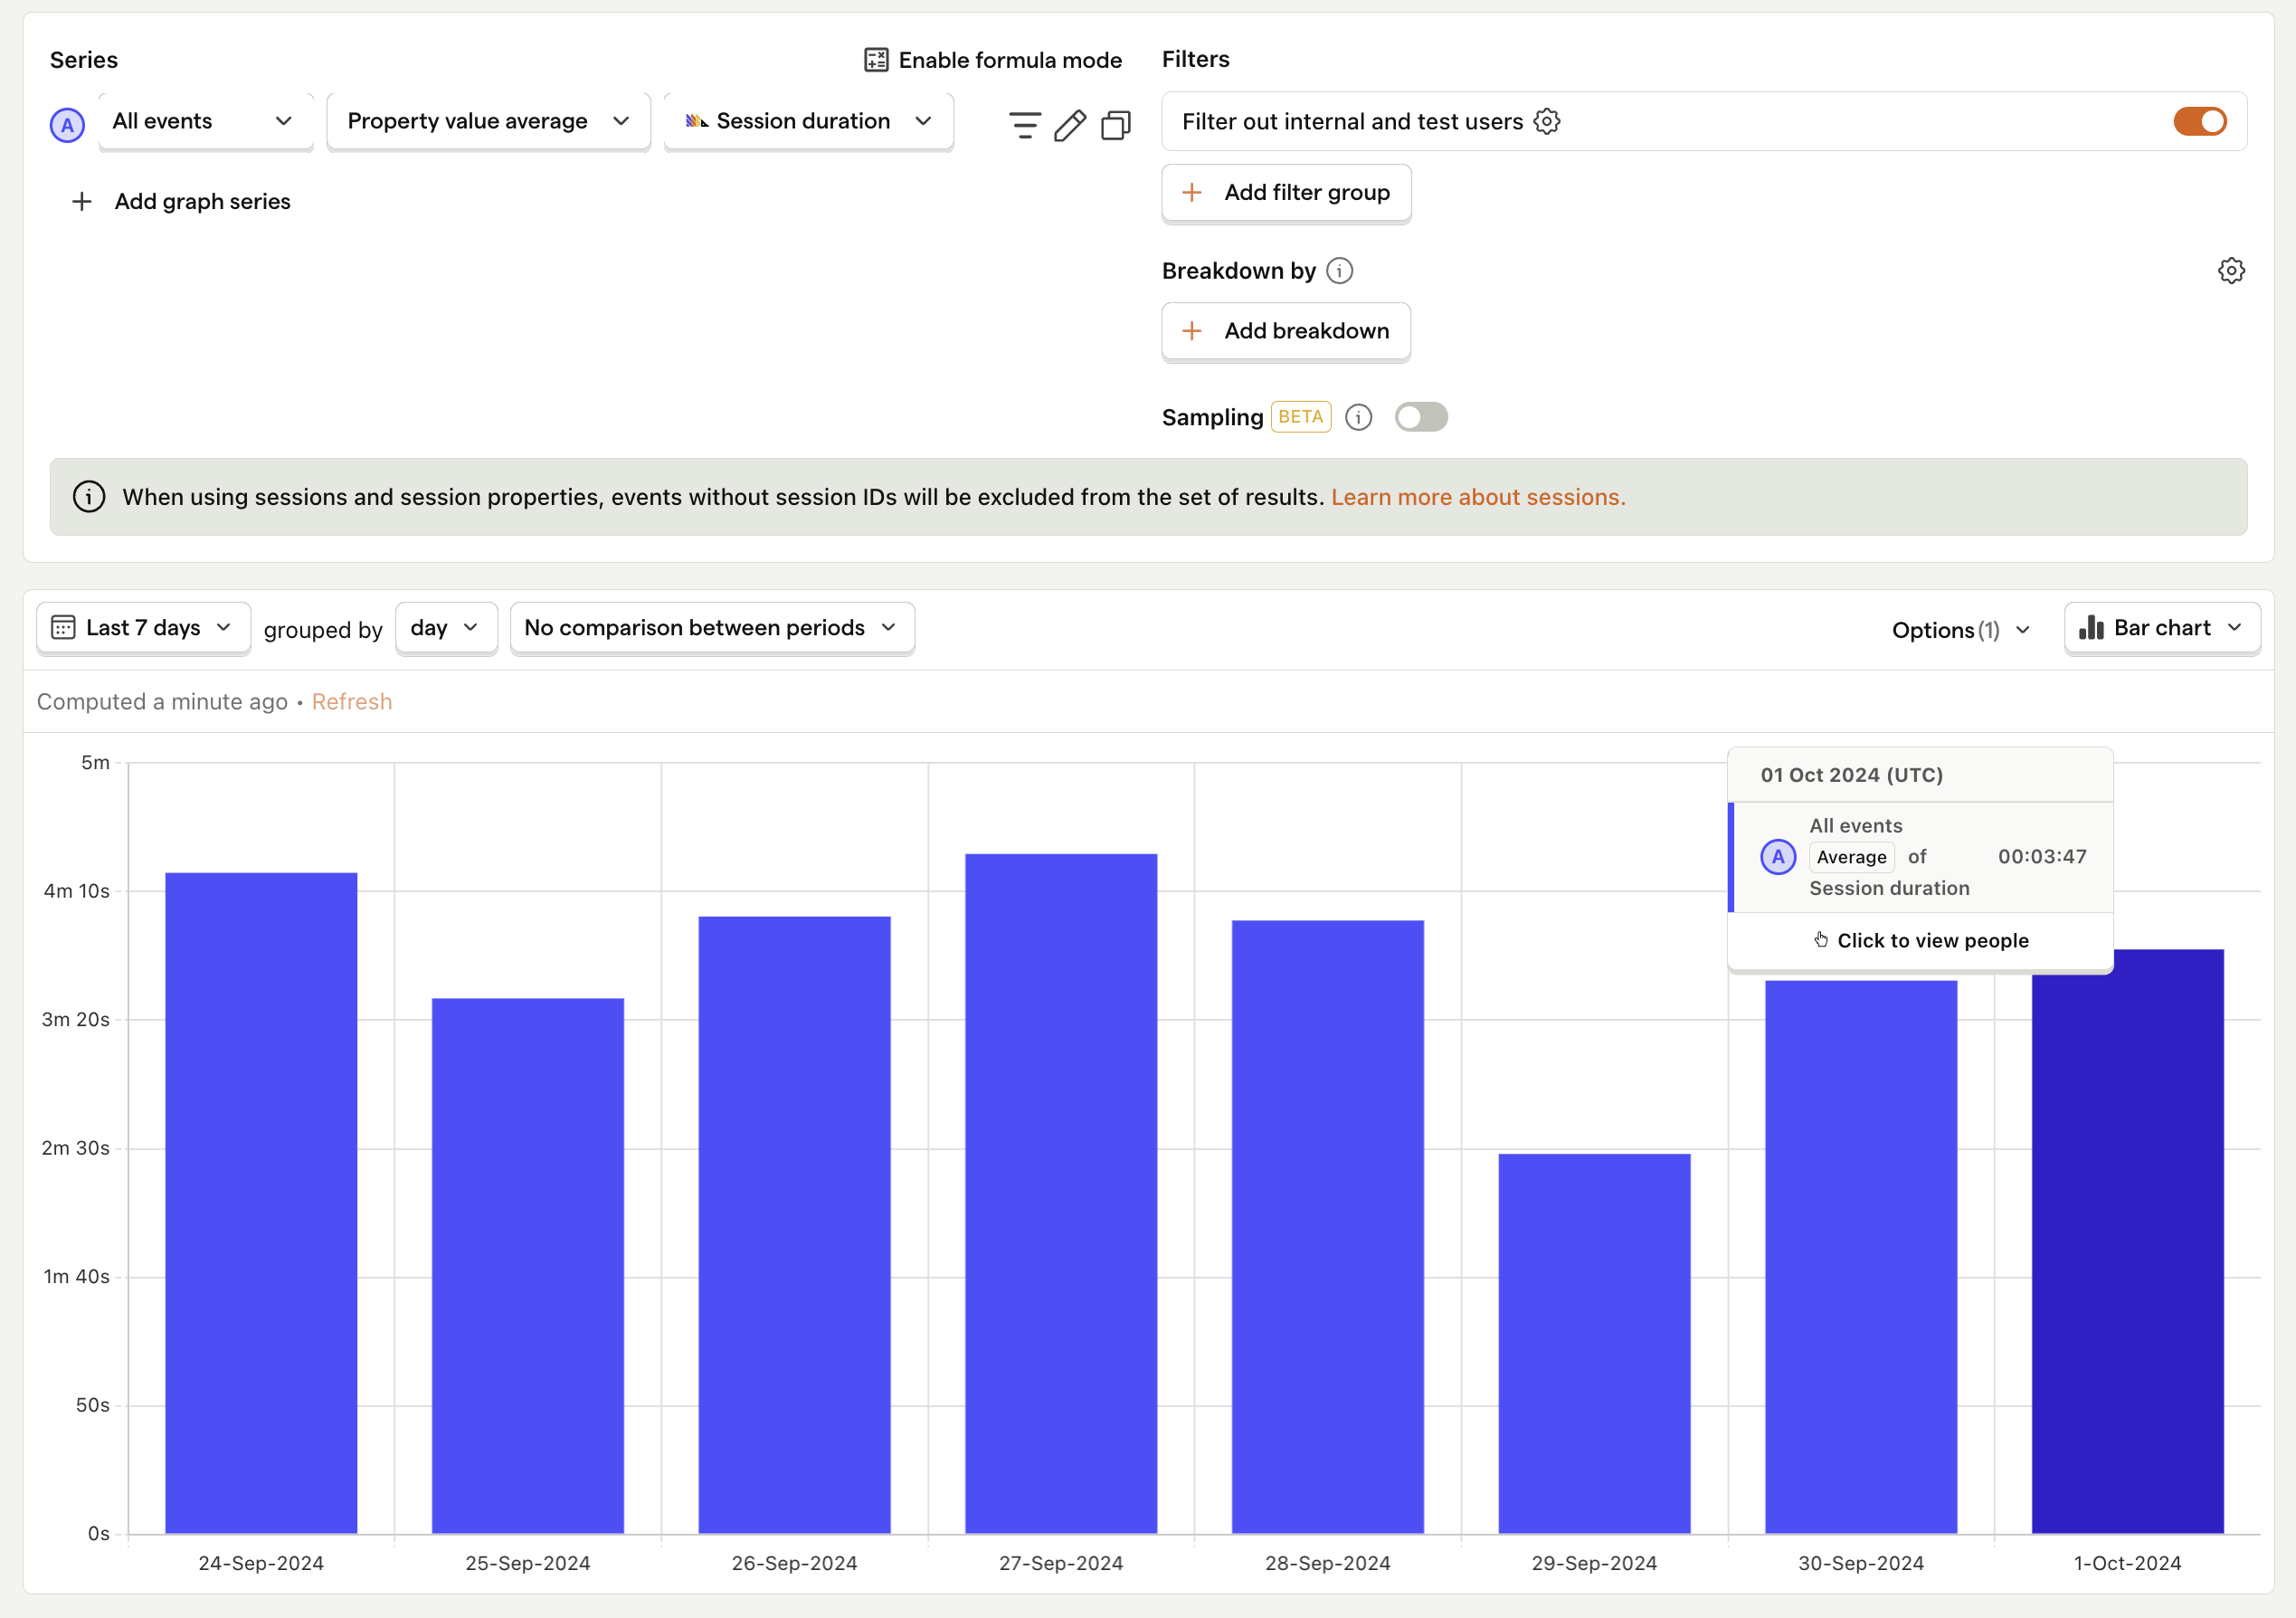
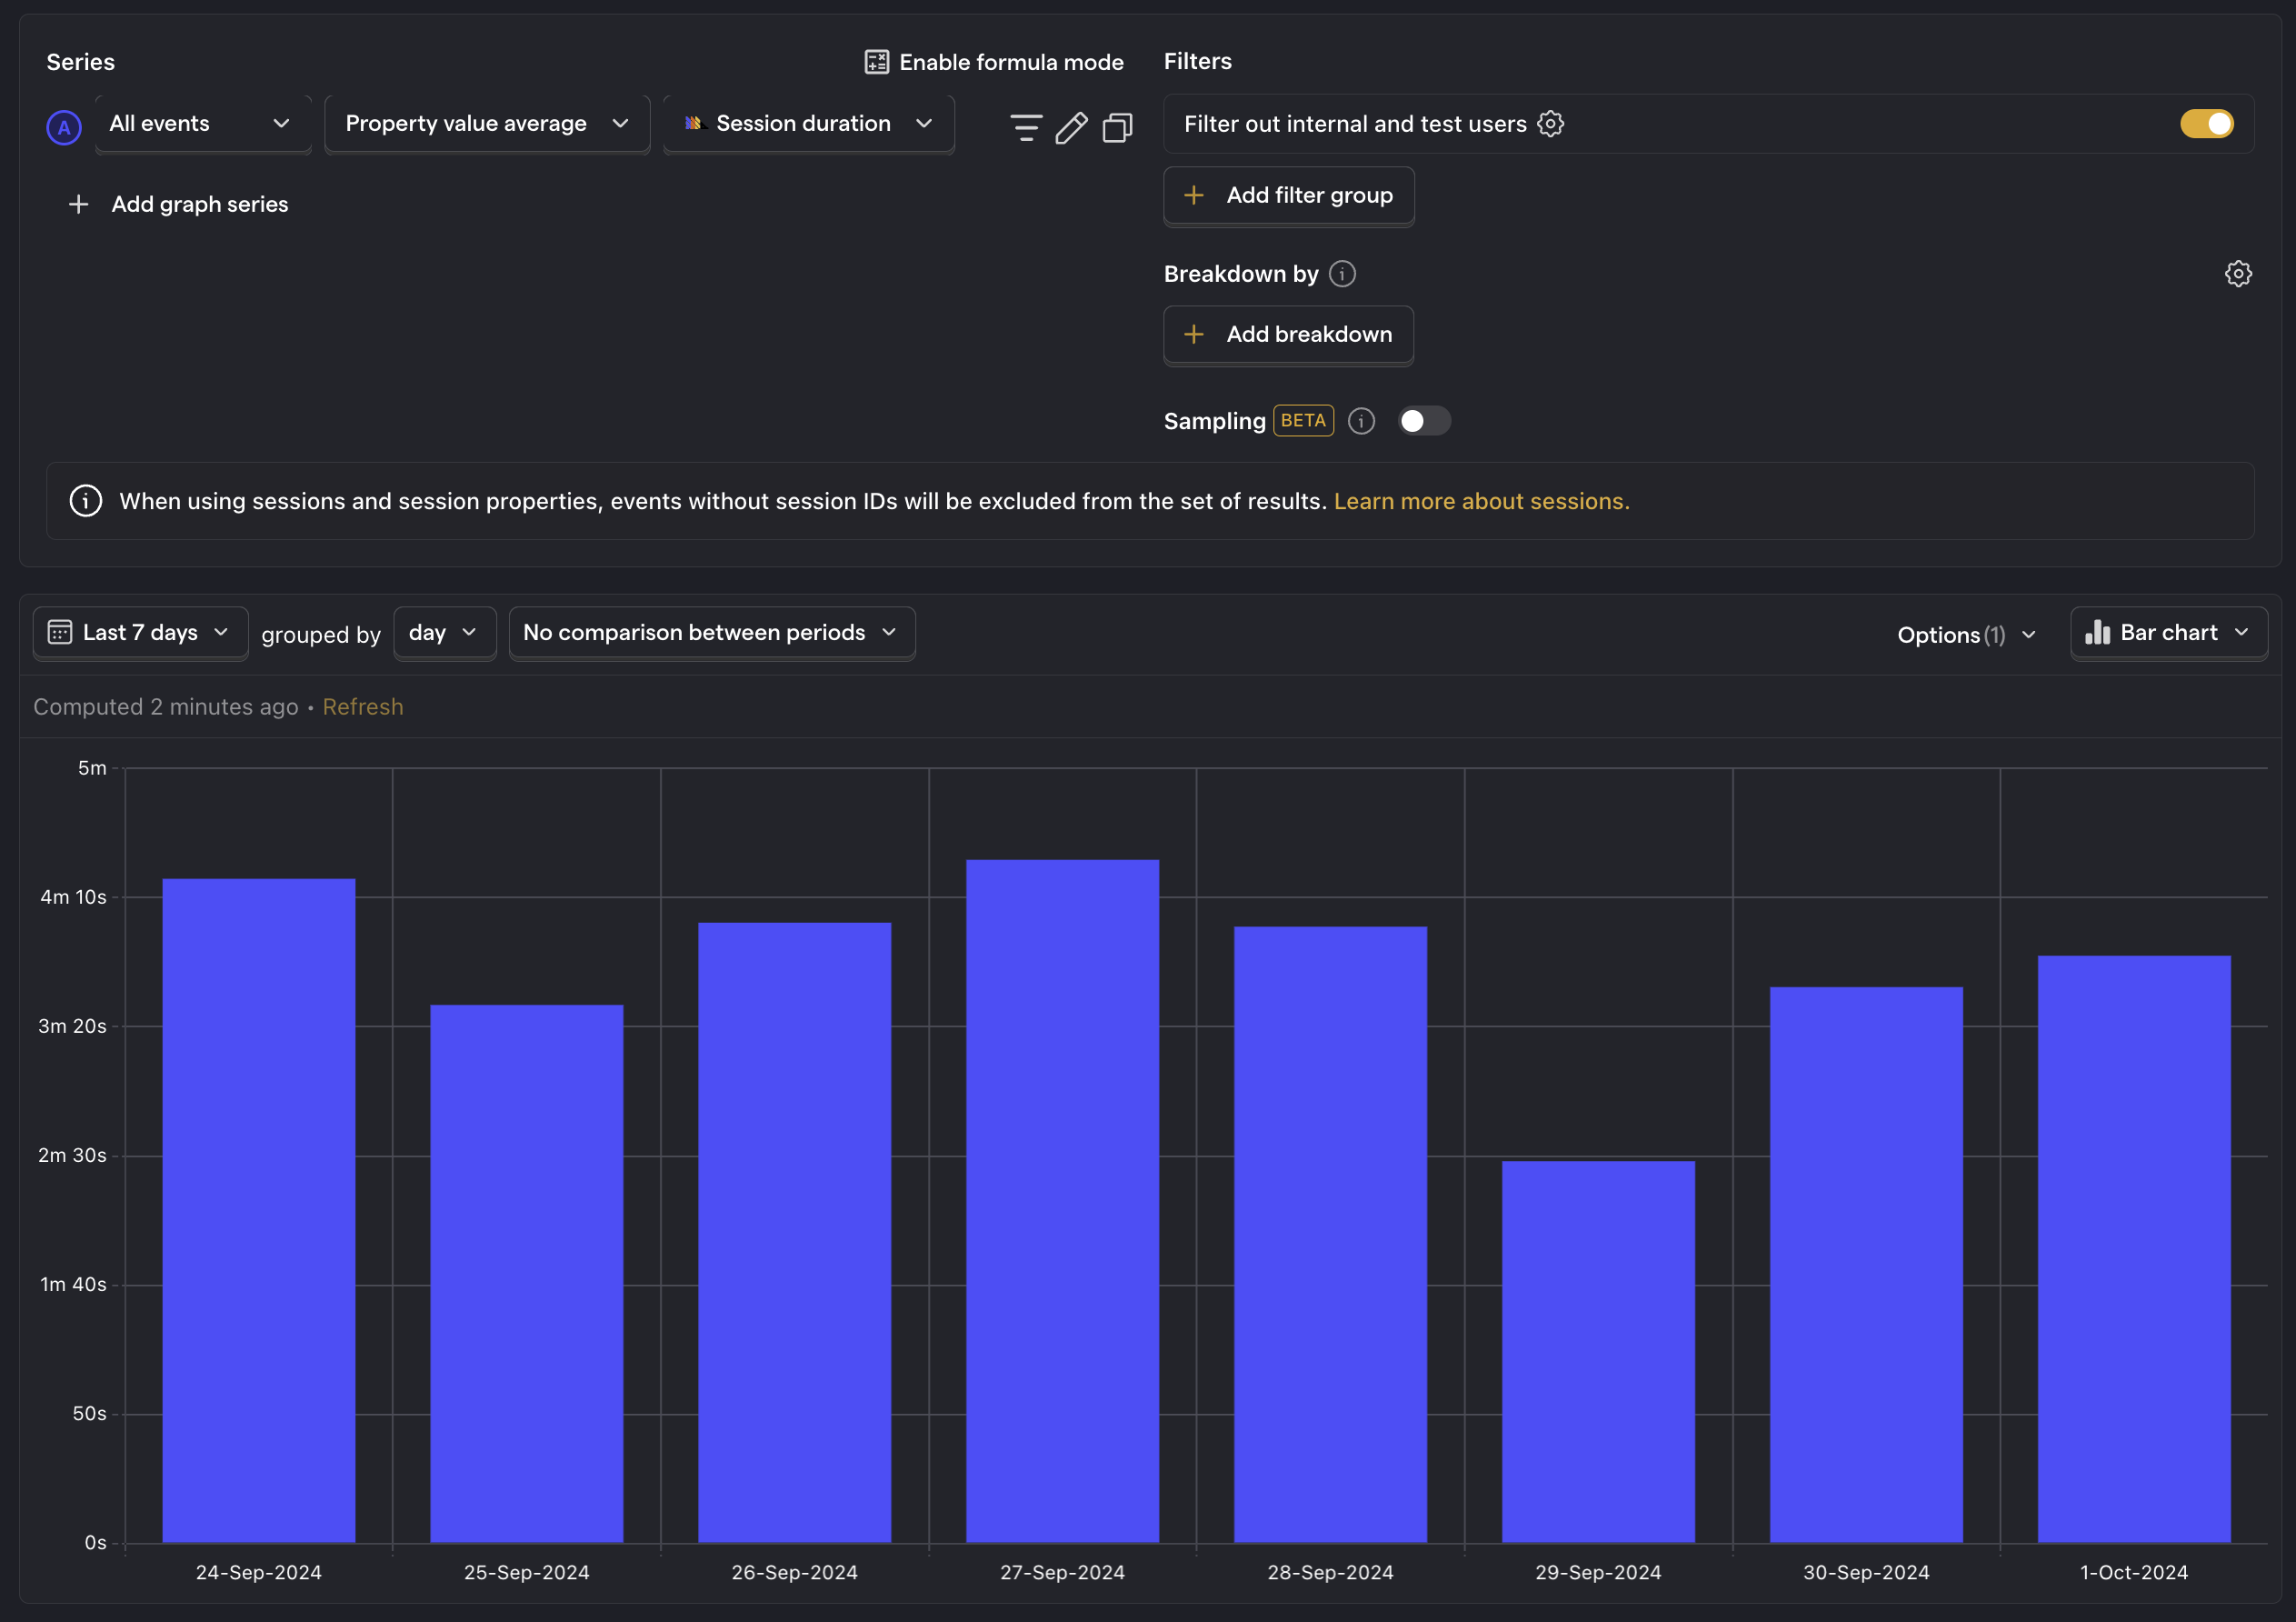
10. Average session length
What is it? The average length of time a user spends in your app during a single session.
Why is it useful? Helps you understand how long users are engaging with your app and identify opportunities to keep them engaged longer.
Good benchmark: Varies depending on app type. 443 seconds for entertainment apps, 69 seconds for business apps, and 64 seconds for tool apps6
Questions to ask:
- Is there a correlation between session length and user engagement or retention?
- How does the average session length vary across different user segments (e.g., new vs. long-term users)?
- What is the impact of push notifications or email campaigns on session length?
How to track it: Create a trend insight and set the event to All events. Change the aggregation from Total count to Property value - average and then set the property to Session duration. Breakdown by Device Type or OS to see the distribution by platform.
User Retention Metrics
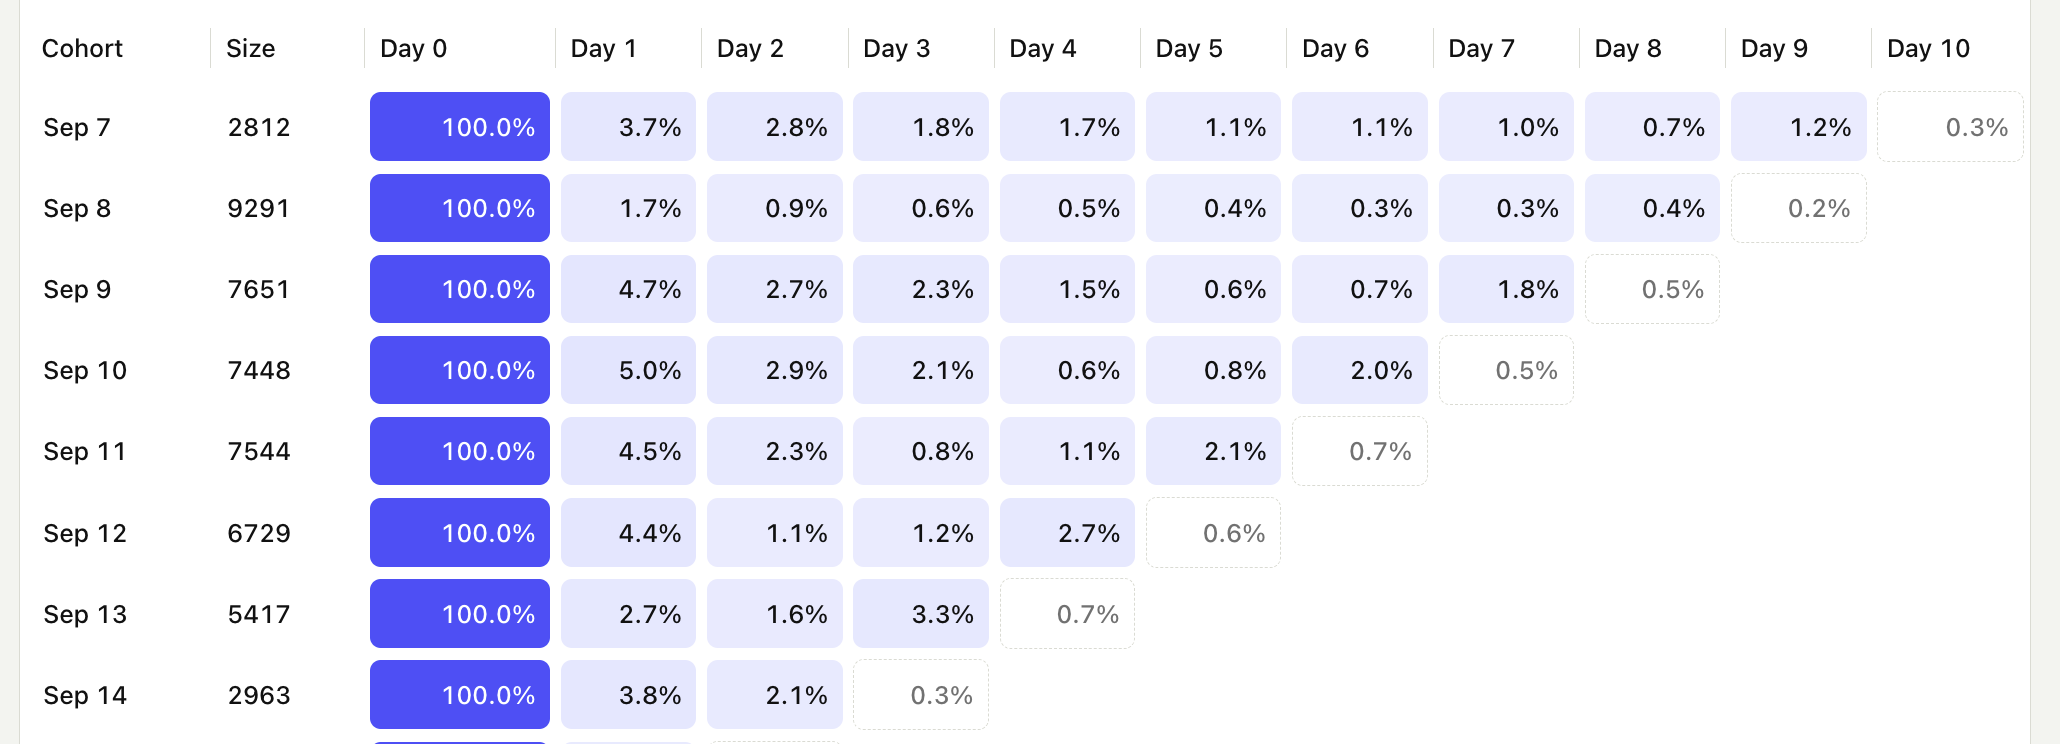
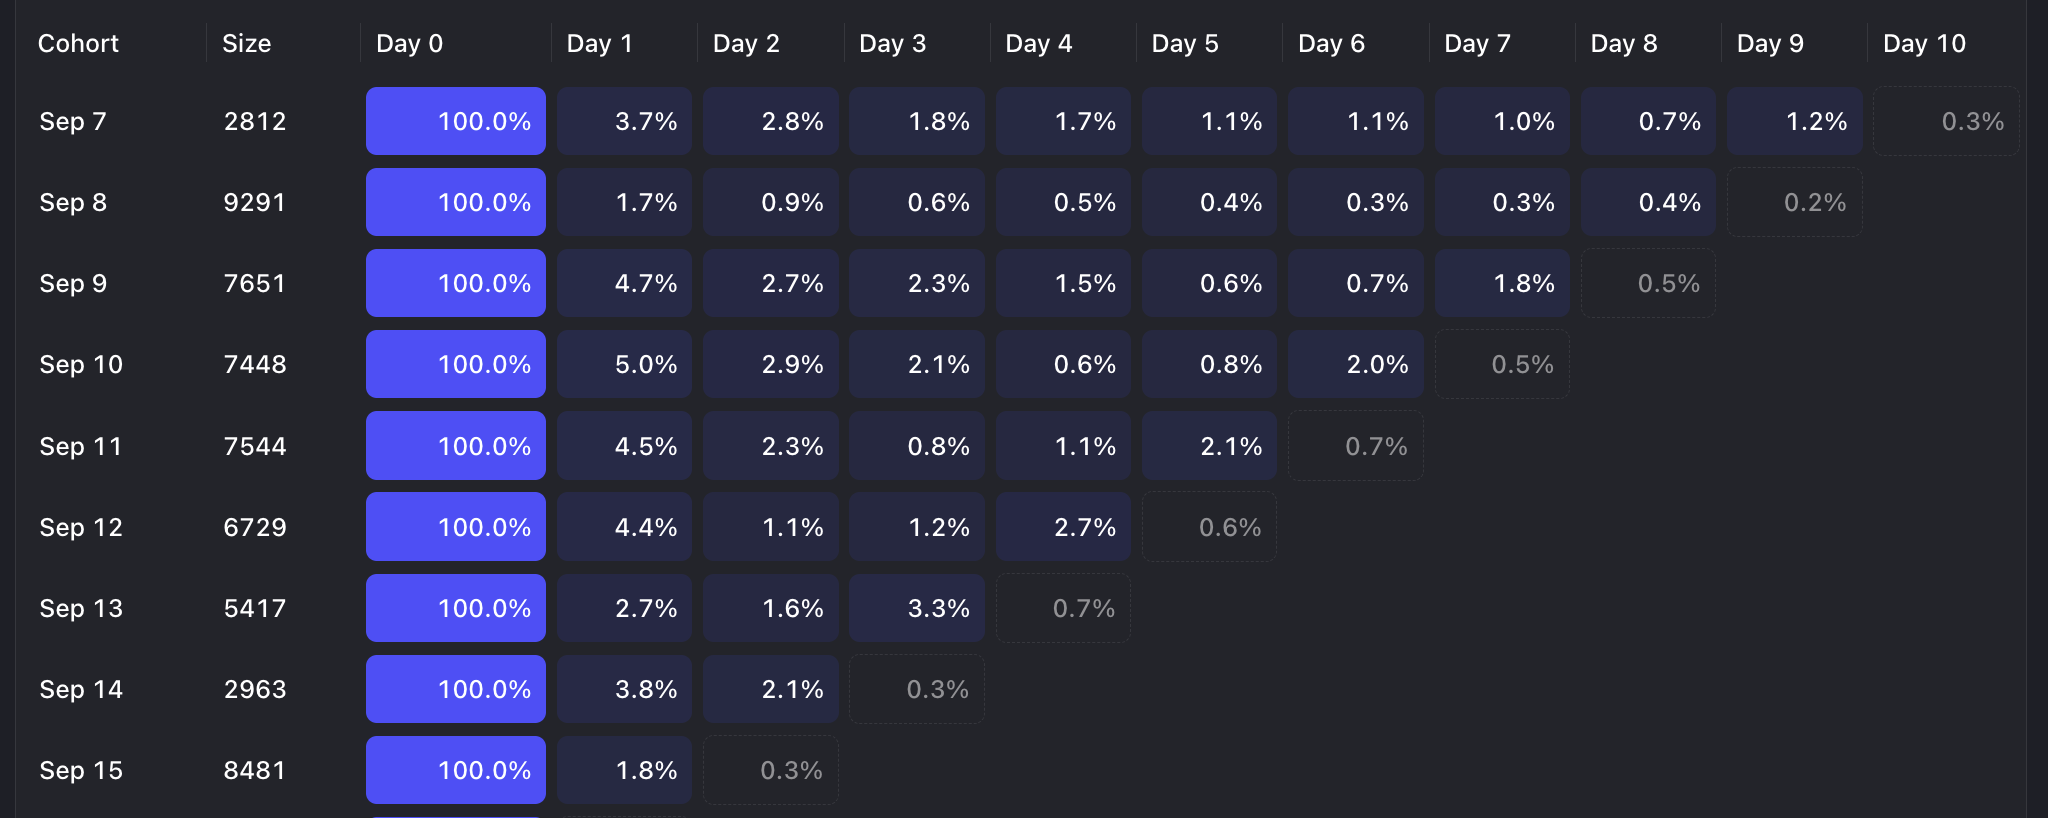
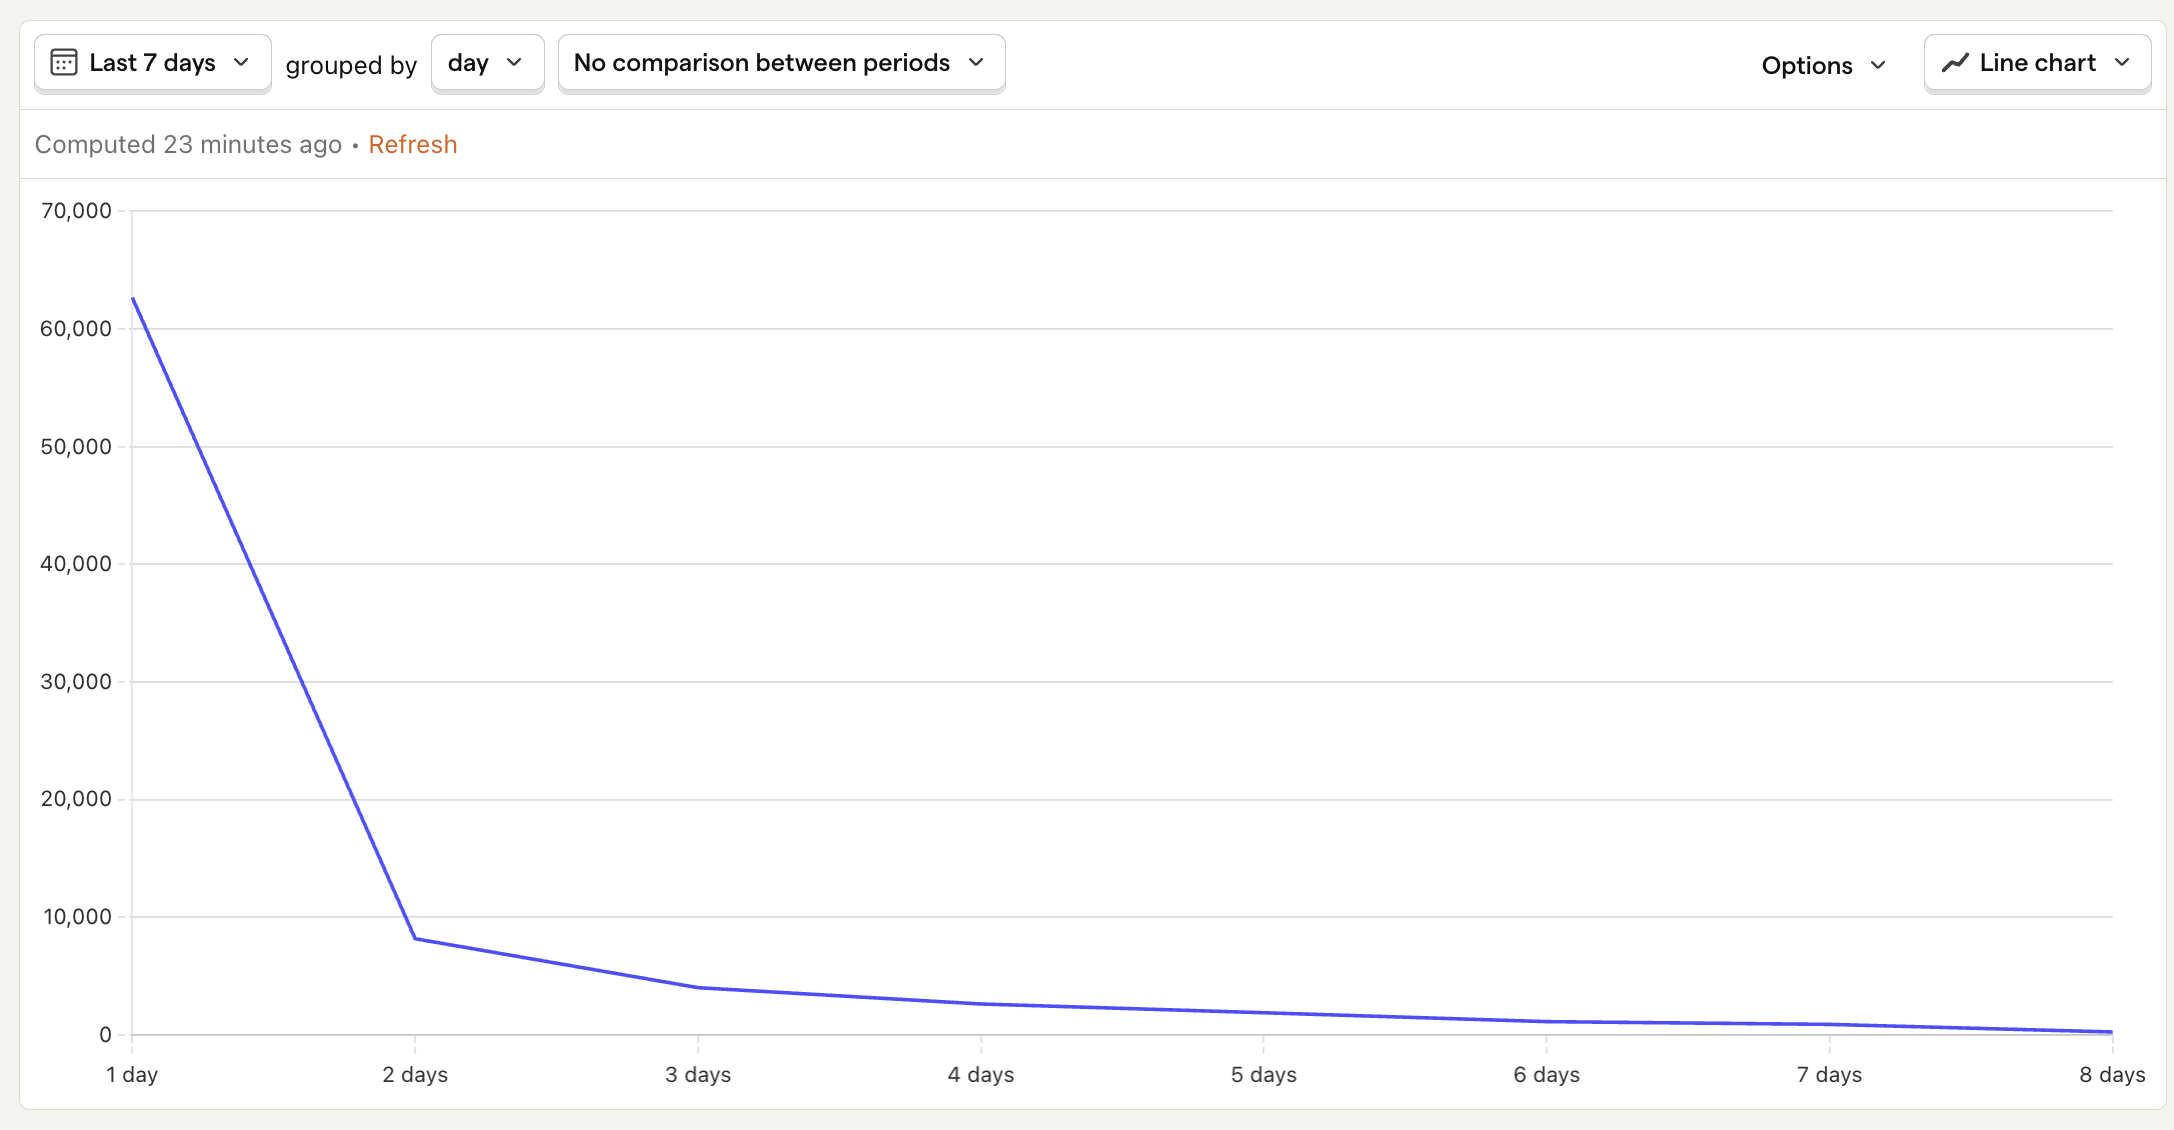
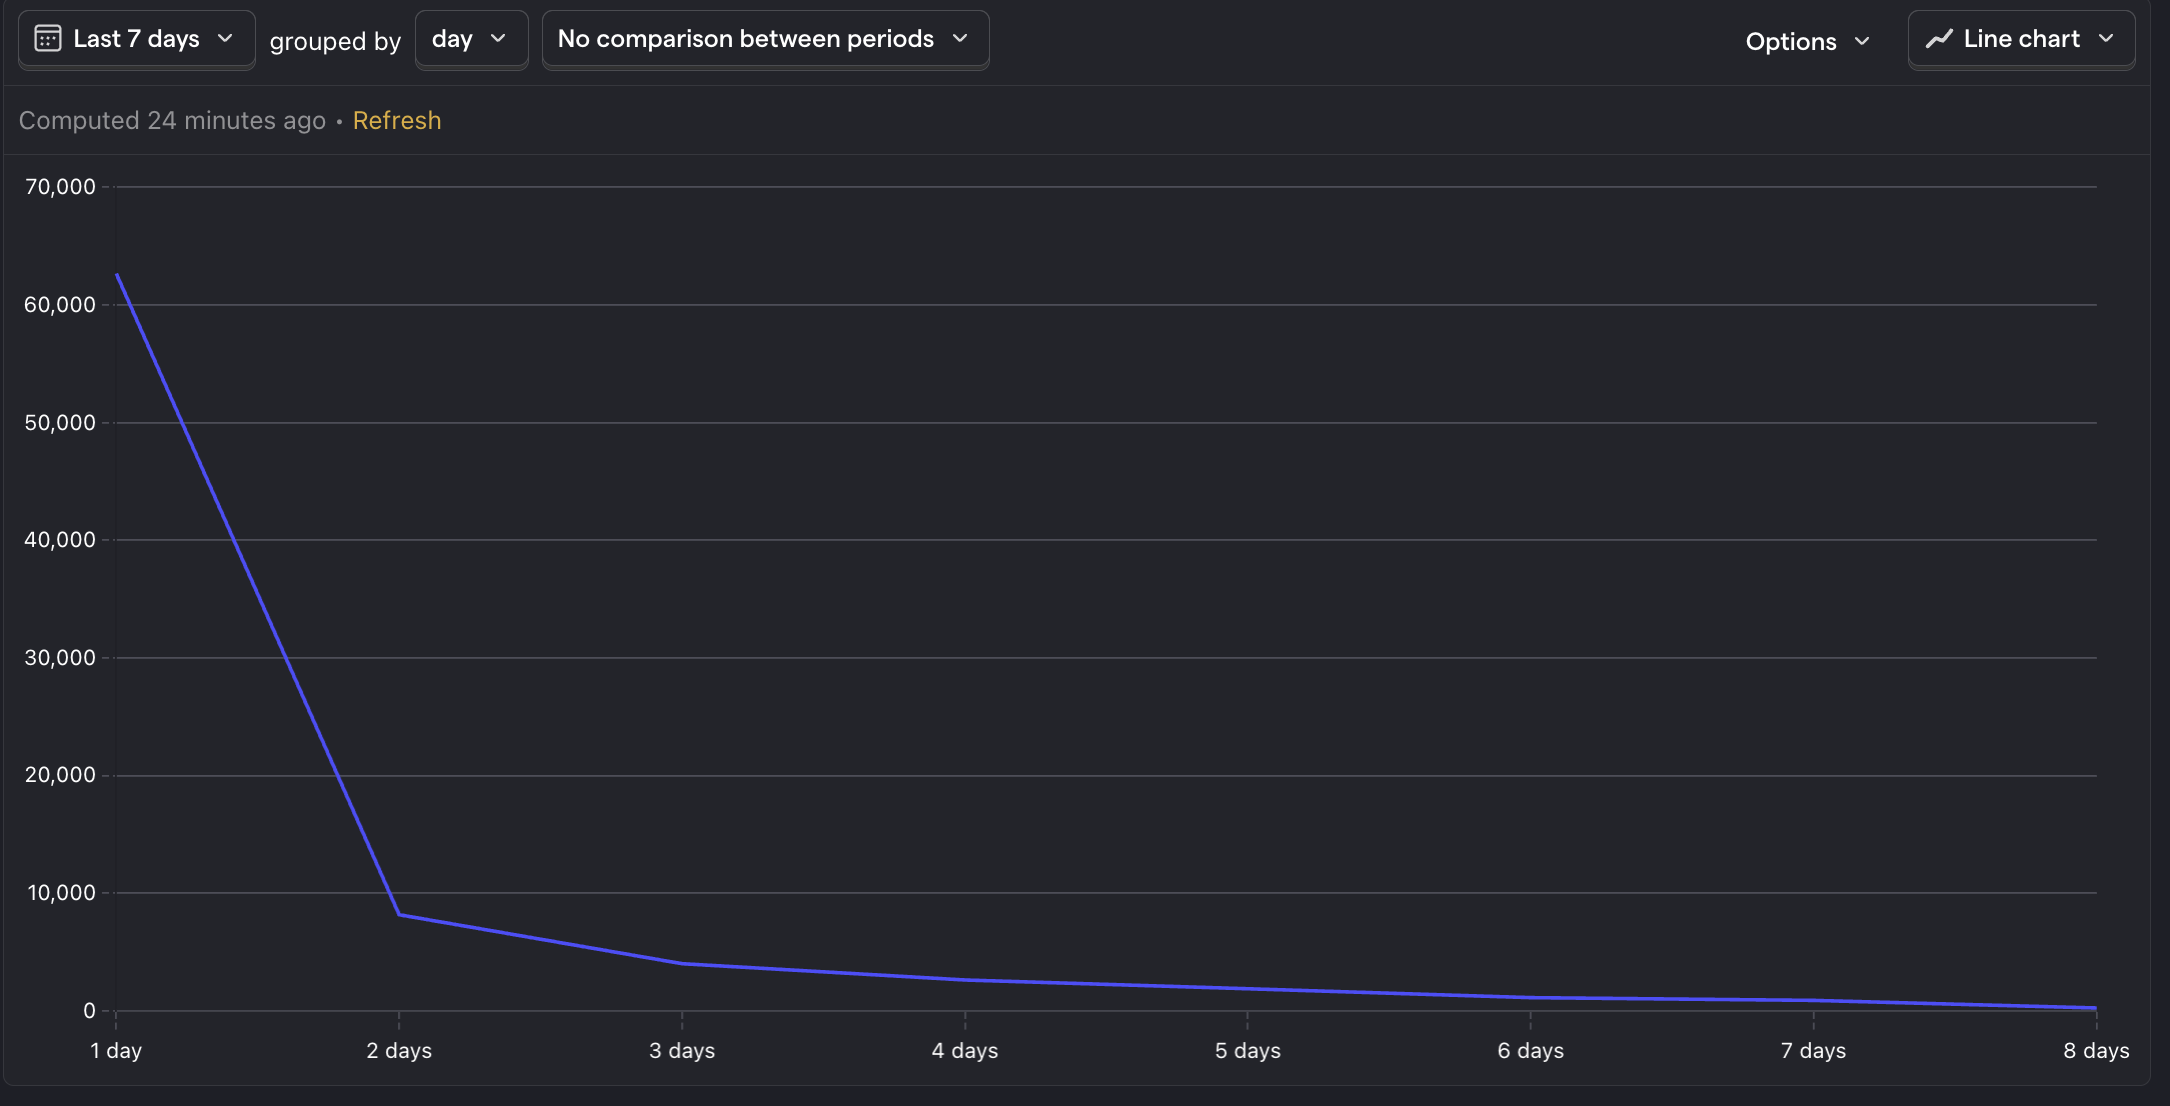
11. N-day retention rate
What is it? The percentage of users who return to your app after their first visit within a specific time frame (e.g., 1-day, 7-day, 30-day retention).
Why is it useful? Helps you understand how well your app keeps users engaged over time.
Good benchmark: Above 20% for 1-day retention, 14% for 3-day, and 10% for 7-day7
Questions to ask:
- What features or actions are associated with higher retention rates?
- How does the onboarding experience impact long-term retention rates?
- What is the relationship between user feedback (e.g., ratings, reviews) and retention rates?
How to track it: Create a retention insight and set the event to Pageview.
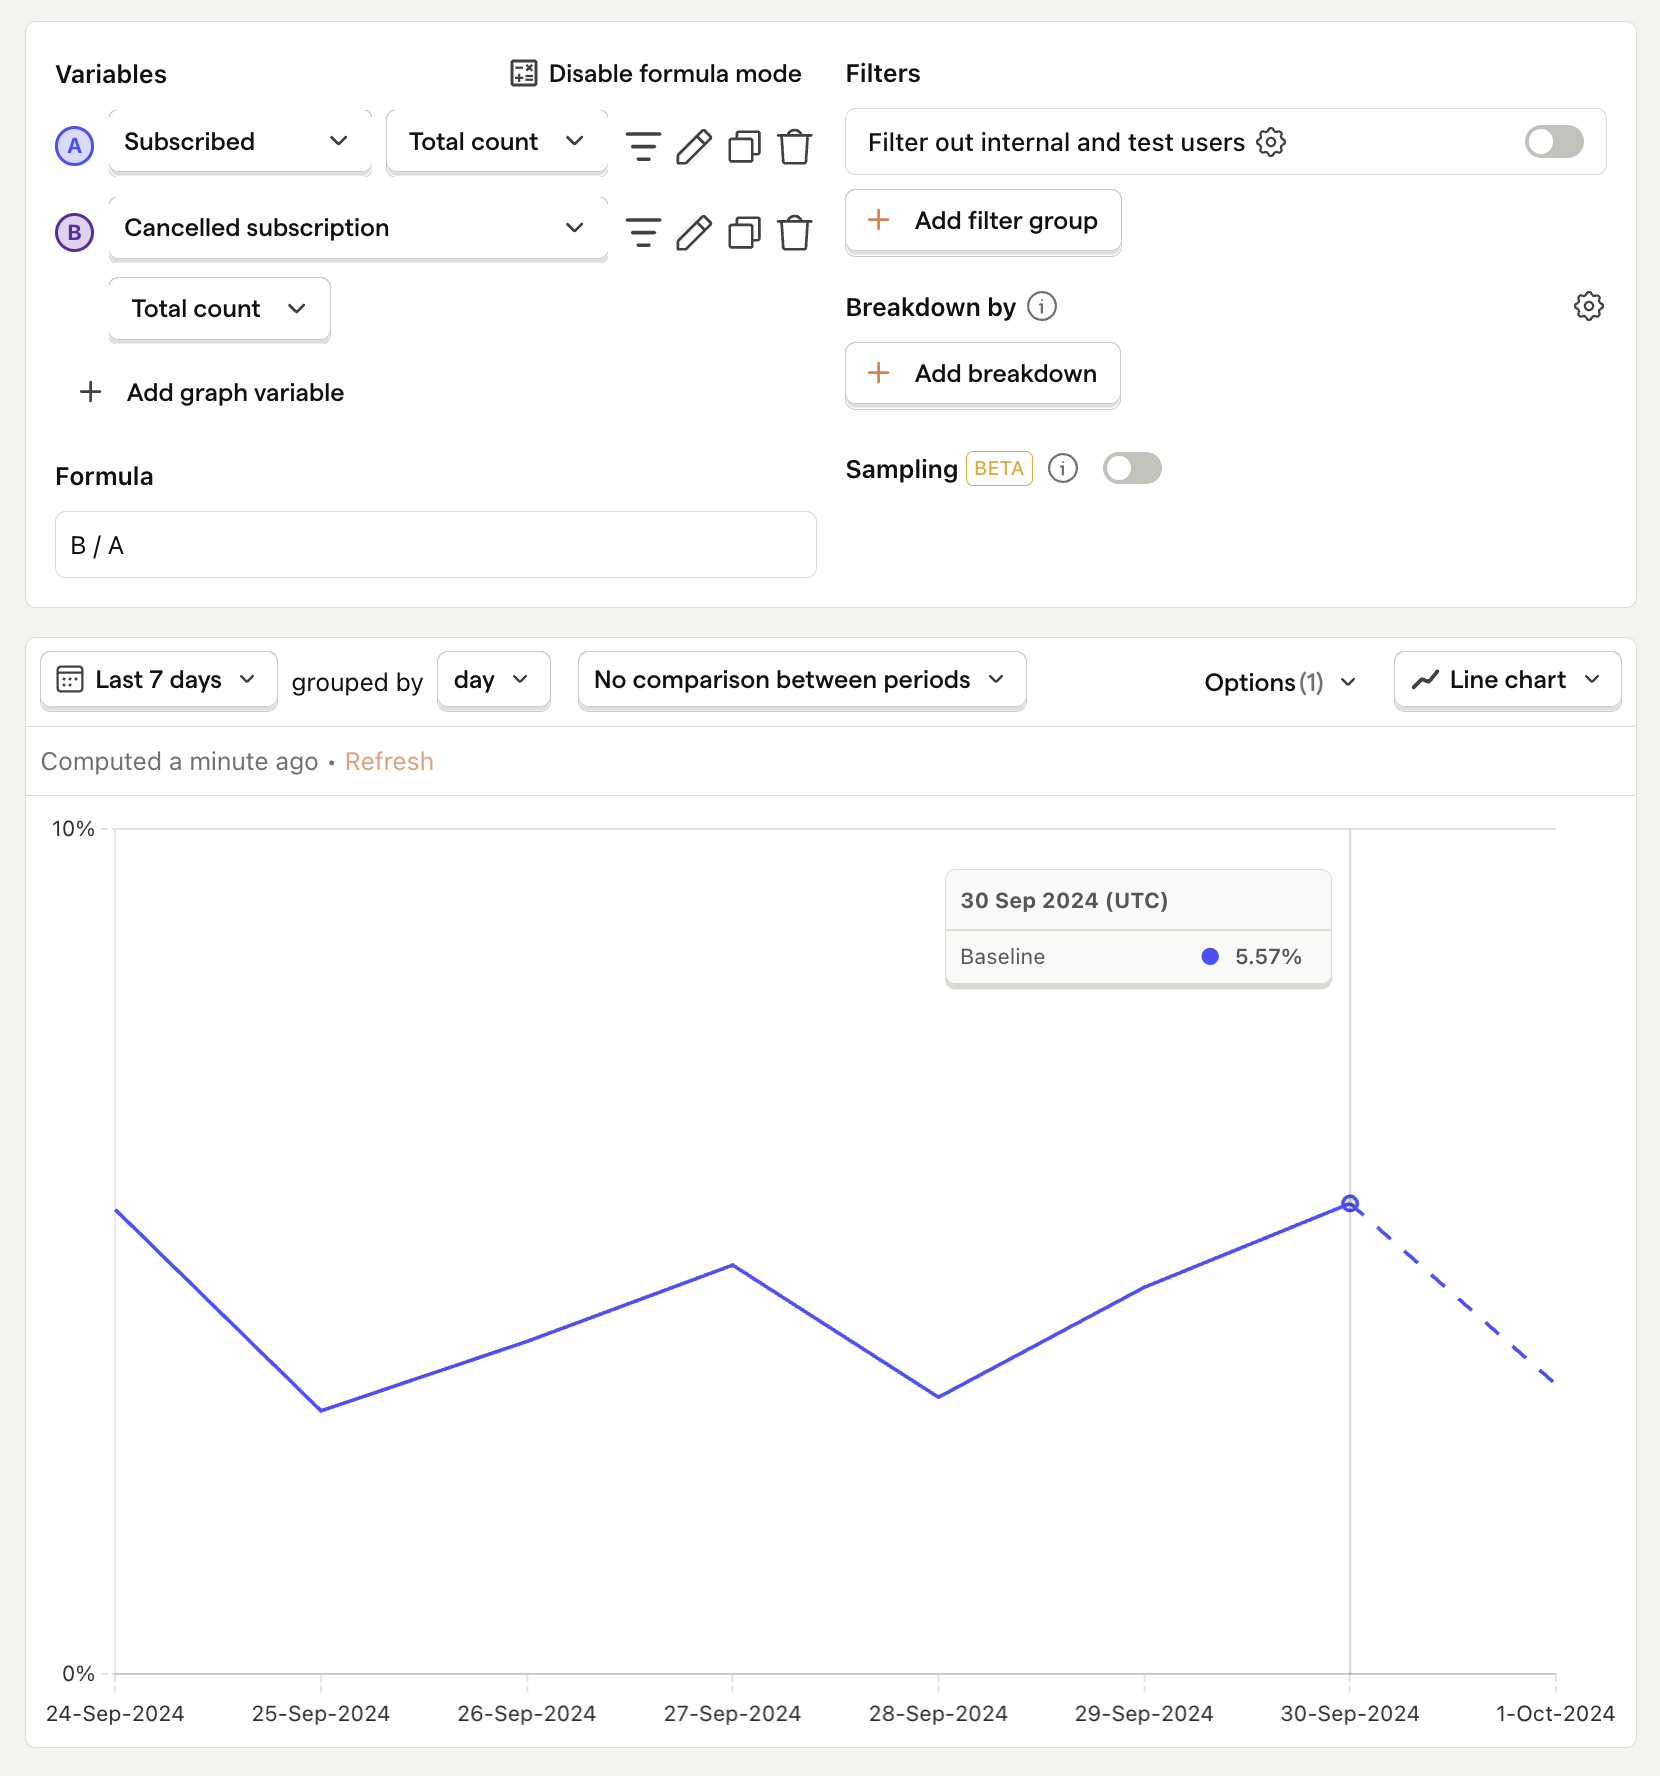
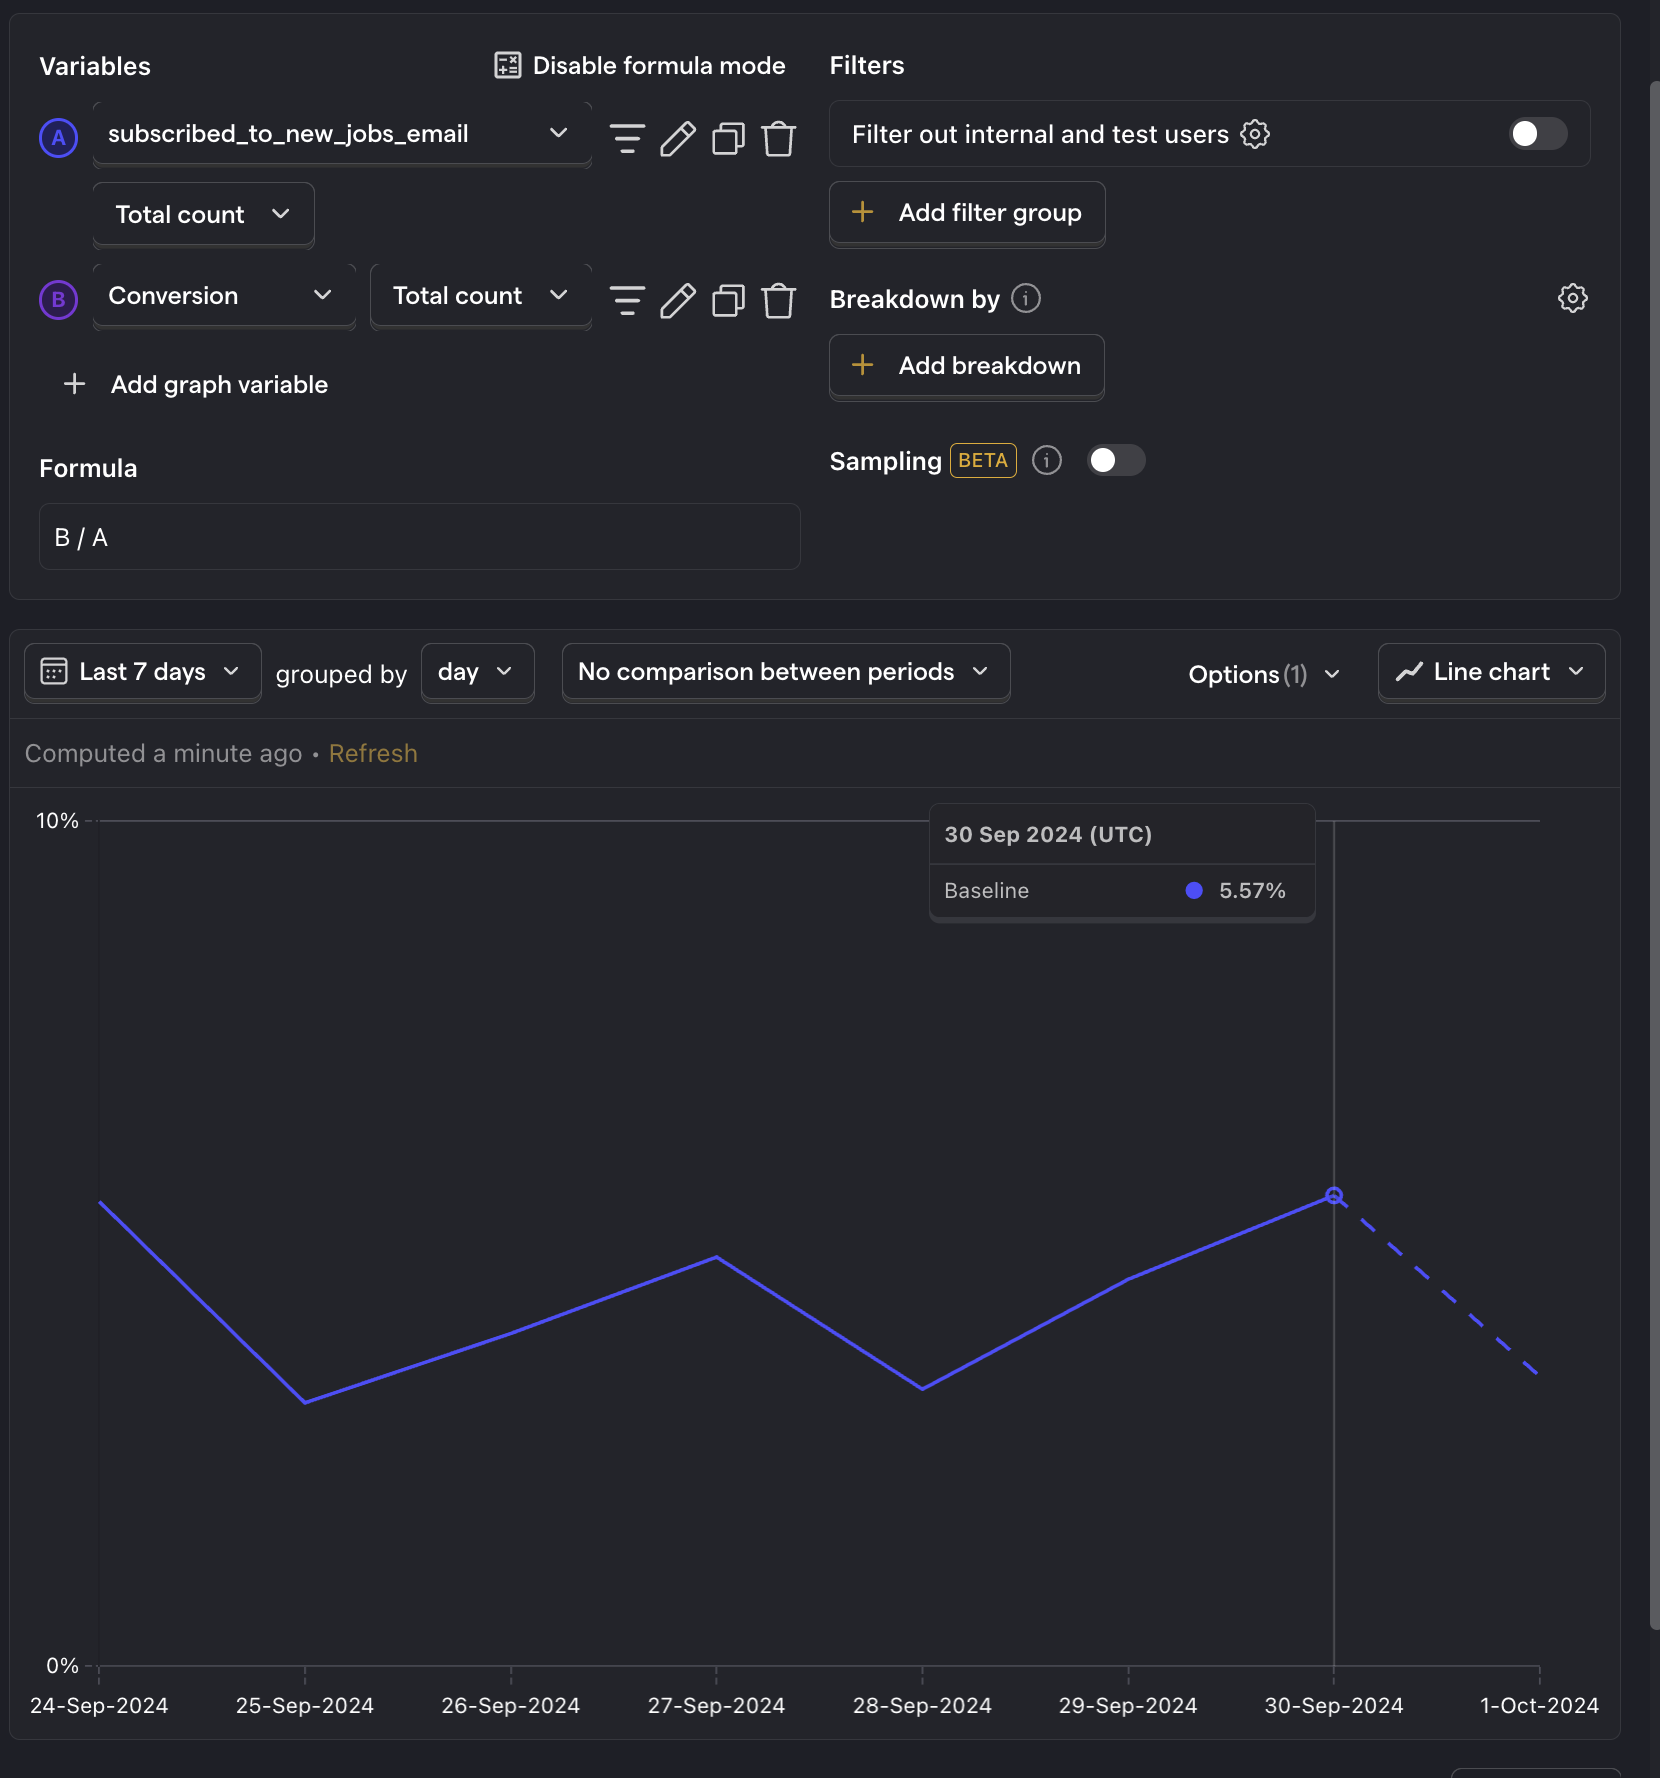
12. Churn rate
What is it? The percentage of users who cancel their subscriptions.
Why is it useful? Identifies how quickly you're losing users and helps focus efforts on retention strategies.
Good benchmark: Less than 96% within 30 days8
Questions to ask:
- Are there specific points in the user journey where churn is more likely to occur?
- How does churn rate correlate with feature adoption?
- How does the churn rate vary between different subscription tiers or pricing plans?
How to track it: Create a trend insight with formula mode. Set your A-series to your conversion event and the B-series to subscription cancellation event. Then in the formula box type B / A.
13. Time between sessions
What is it? The average time between a user's app sessions.
Why is it useful? Helps you understand your app's usage patterns and identify opportunities to re-engage users.
Good benchmark: Varies depending on the app type.
Questions to ask:
- Is there a correlation between time between sessions and likelihood of churn?
- How do push notifications or email campaigns affect the time between sessions?
- How does the time between sessions compare to the time between engagement in specific features?
How to track it: Capture an event whenever a user launches your app. Then create a stickiness insight using this event.
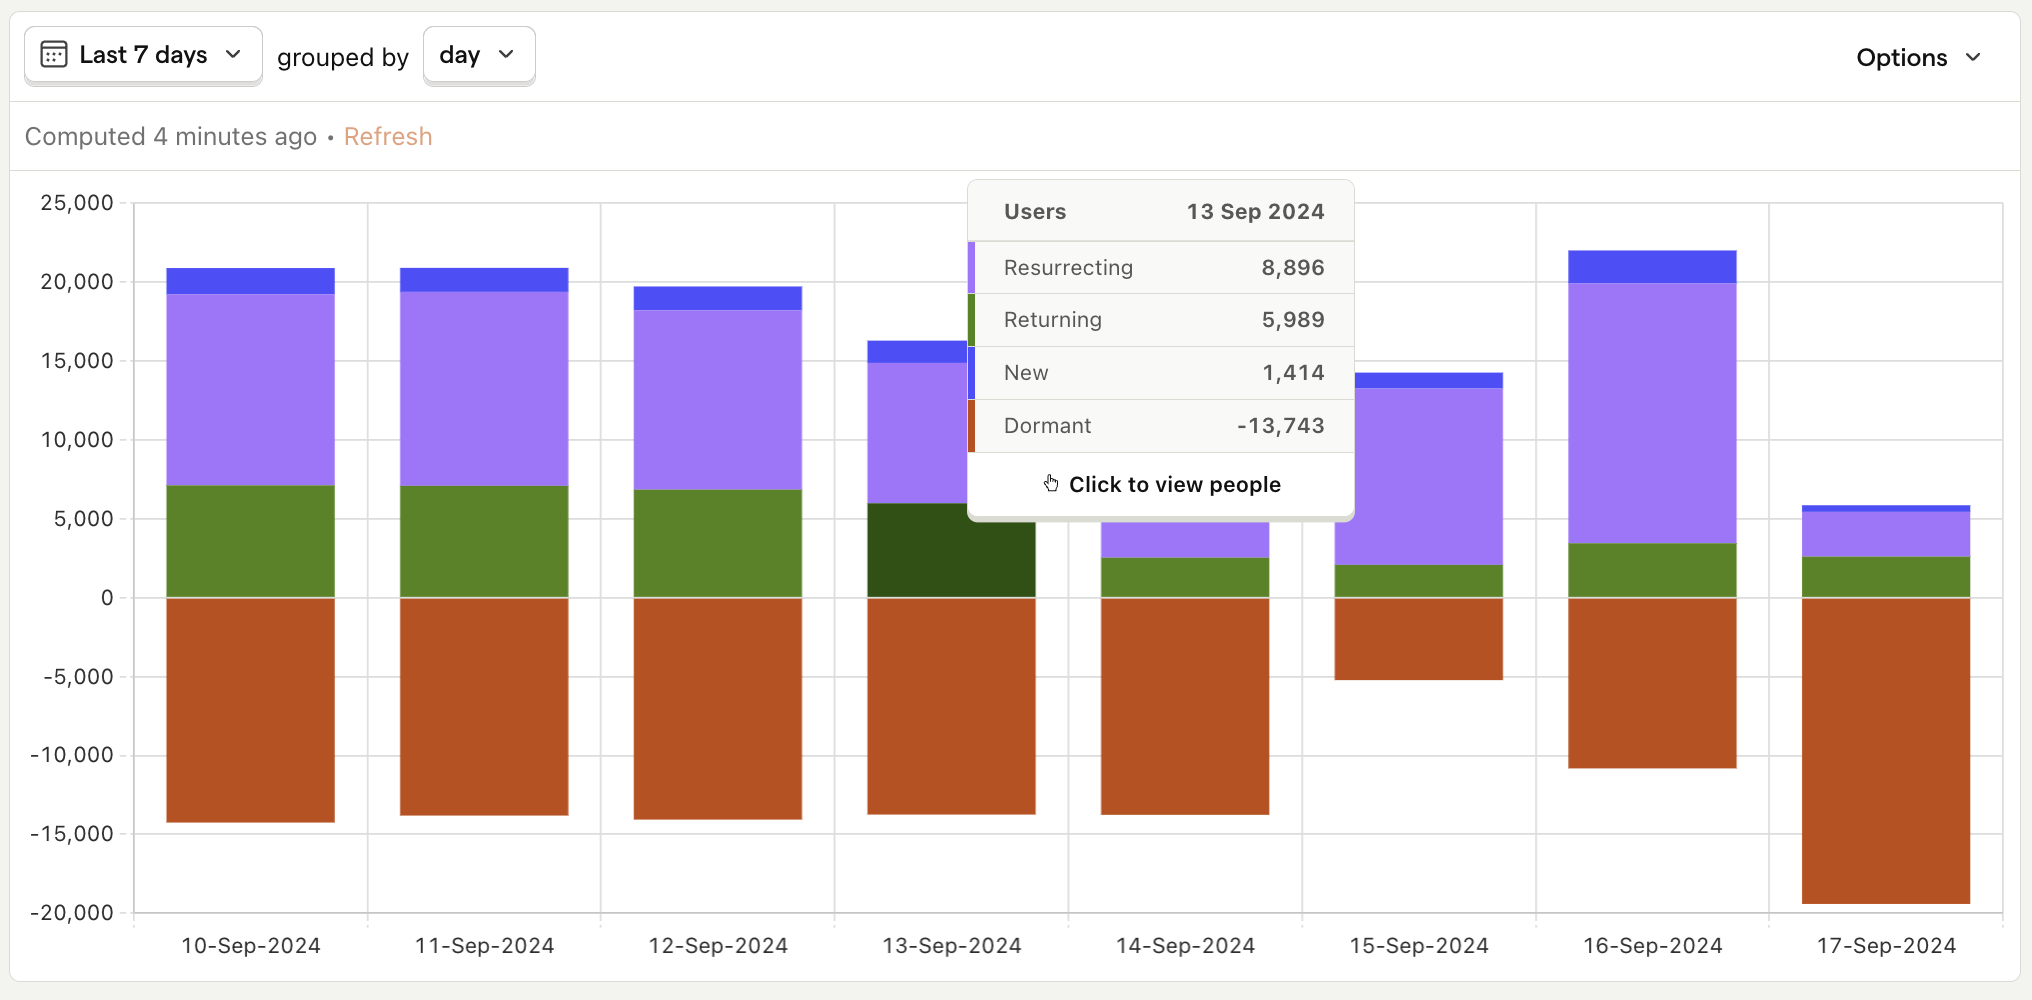
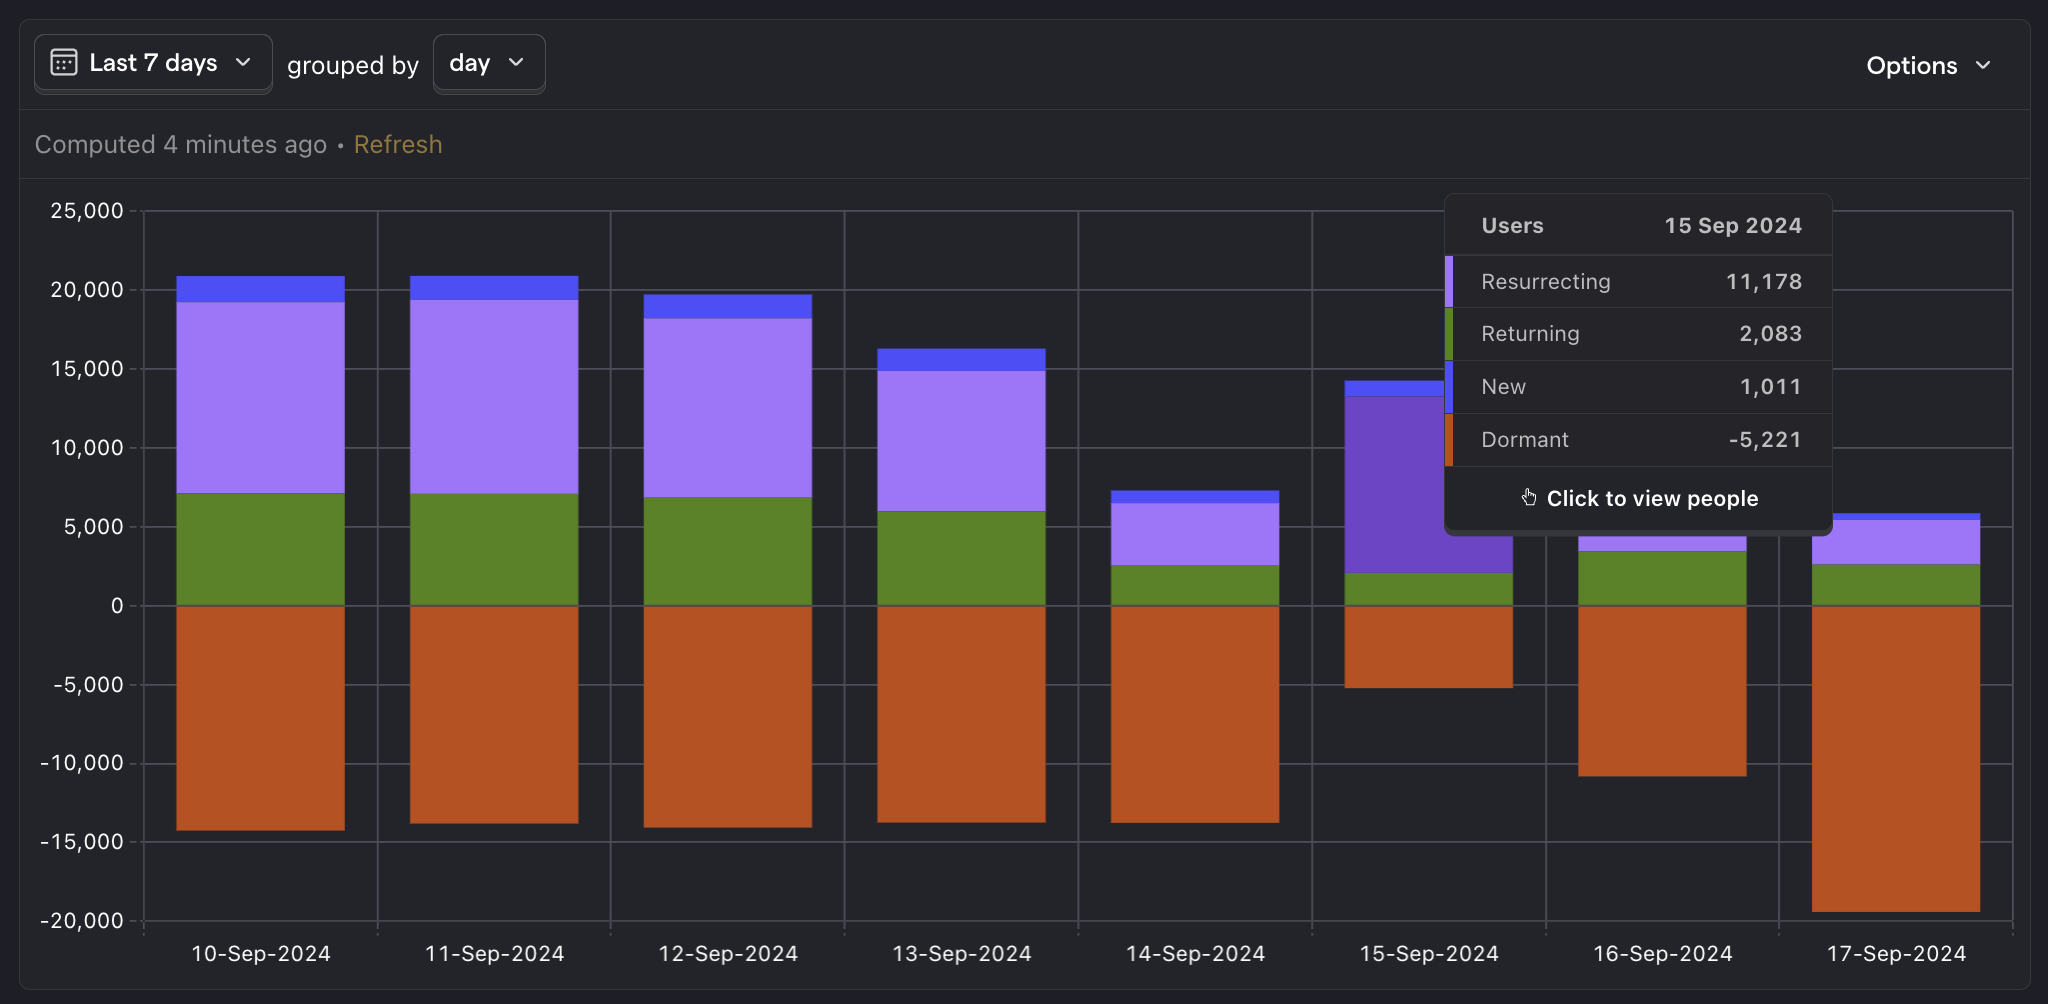
14. Reactivation/Resurrection rate
What is it? The percentage of inactive users who return to your app after a period of inactivity.
Why is it useful? Measures the effectiveness of your re-engagement strategies and the app's ability to win back lapsed users.
Good benchmark: 9% for apps with weekly subscription plans, 12% for monthly, and 6% for annual9
Questions to ask:
- What strategies or campaigns are most effective in reactivating users?
- How does the behavior of reactivated users compare to that of consistently active users?
- What is the long-term retention rate of reactivated users compared to new users?
How to track it: Capture an event whenever a user launches your app. Then create a lifecycle insight using this event.
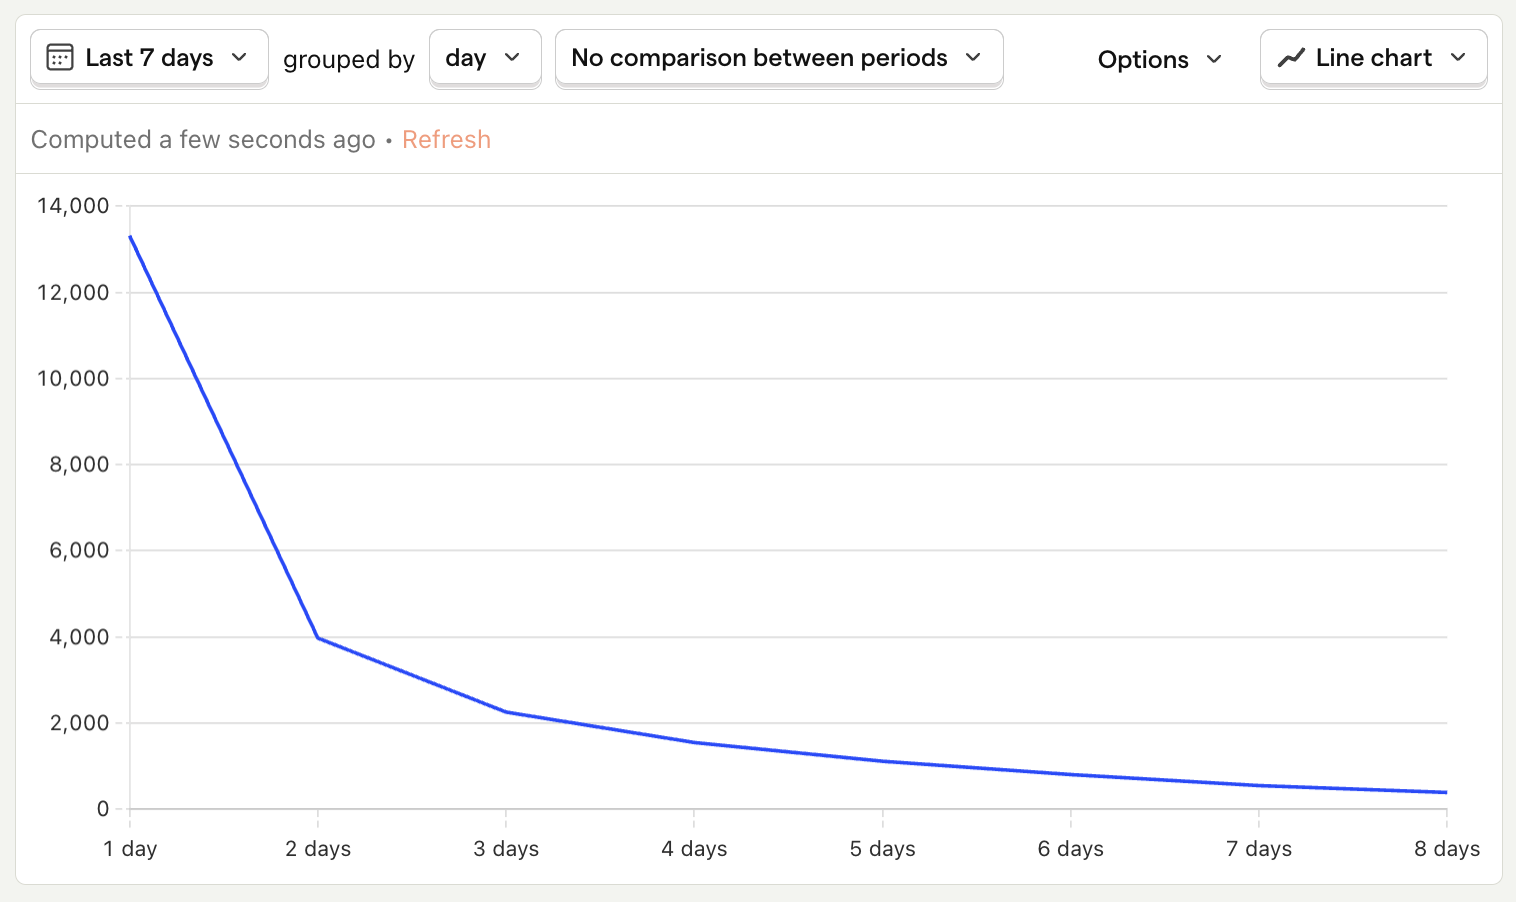
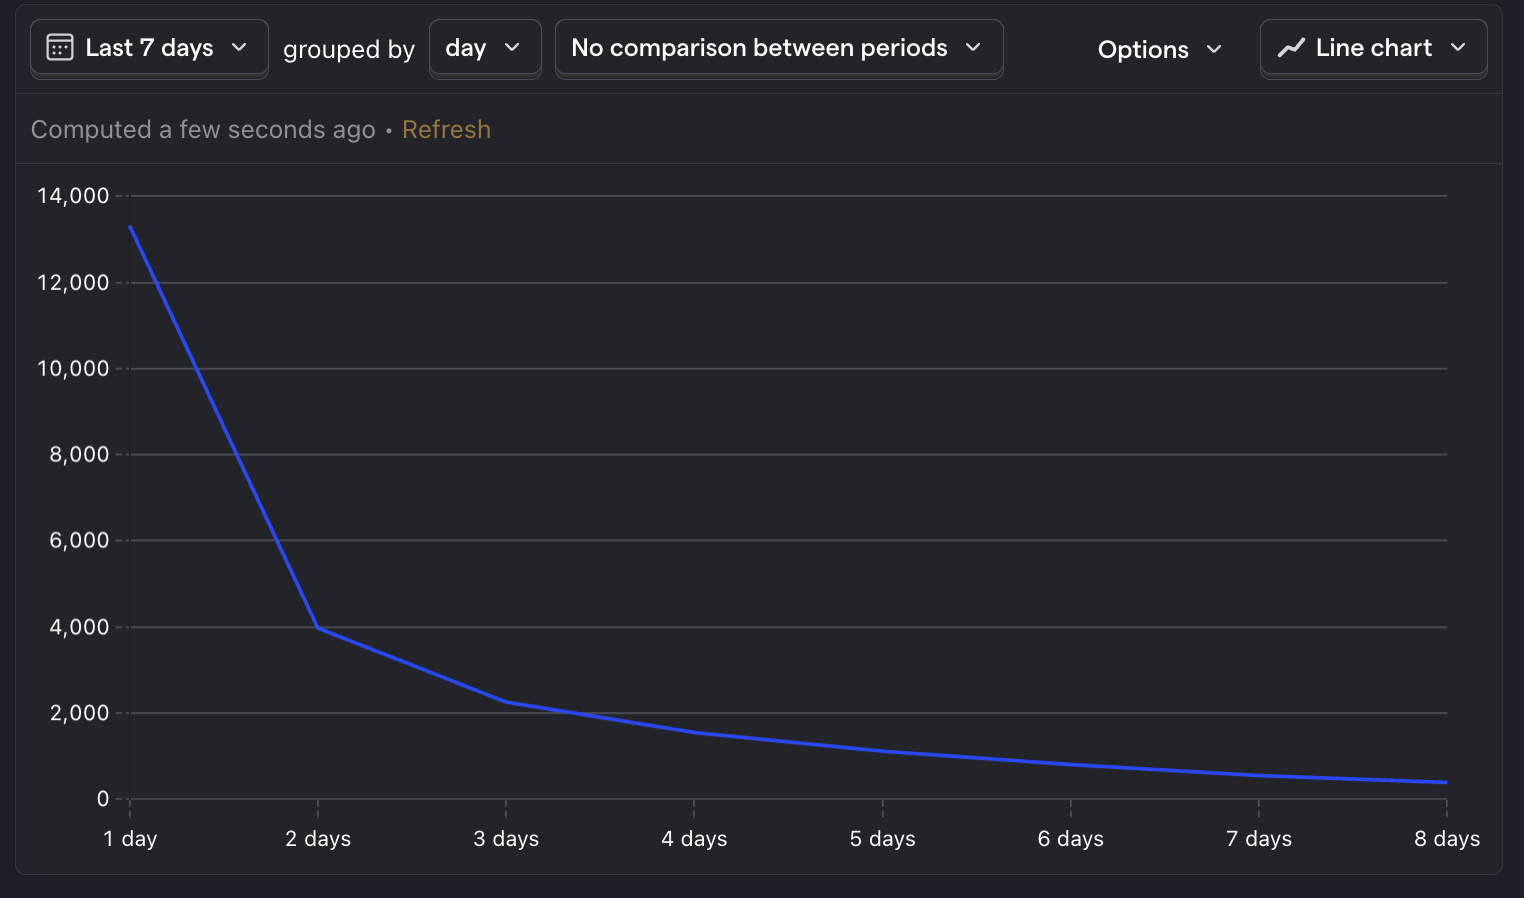
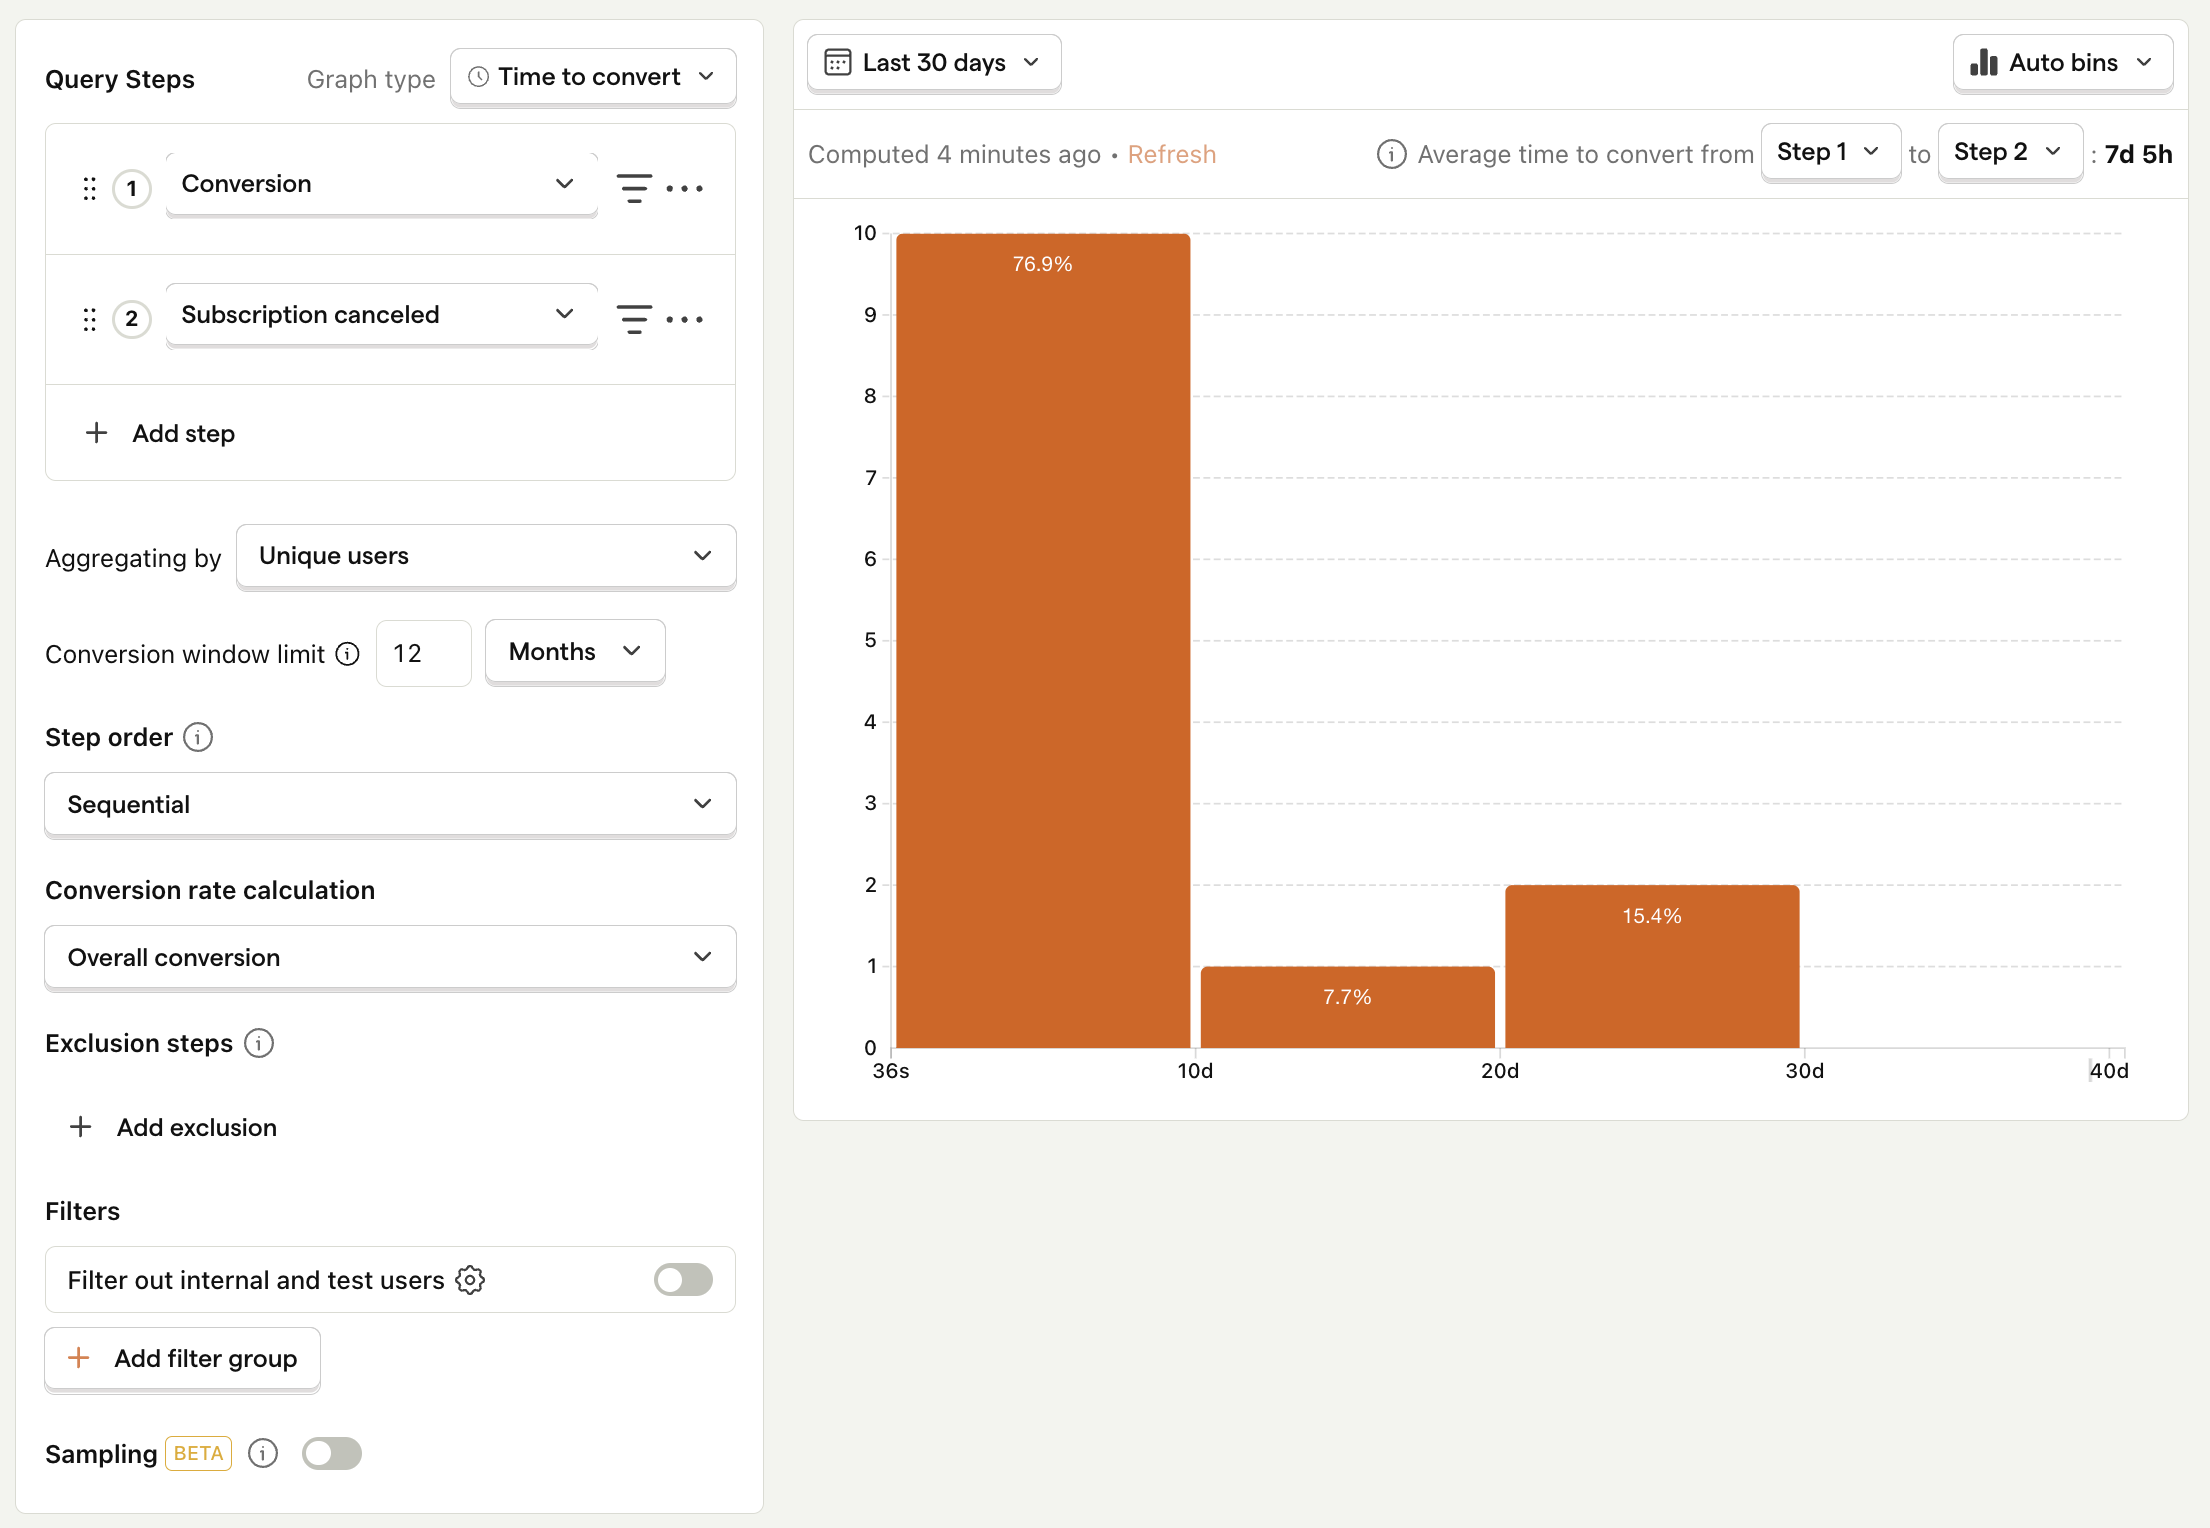
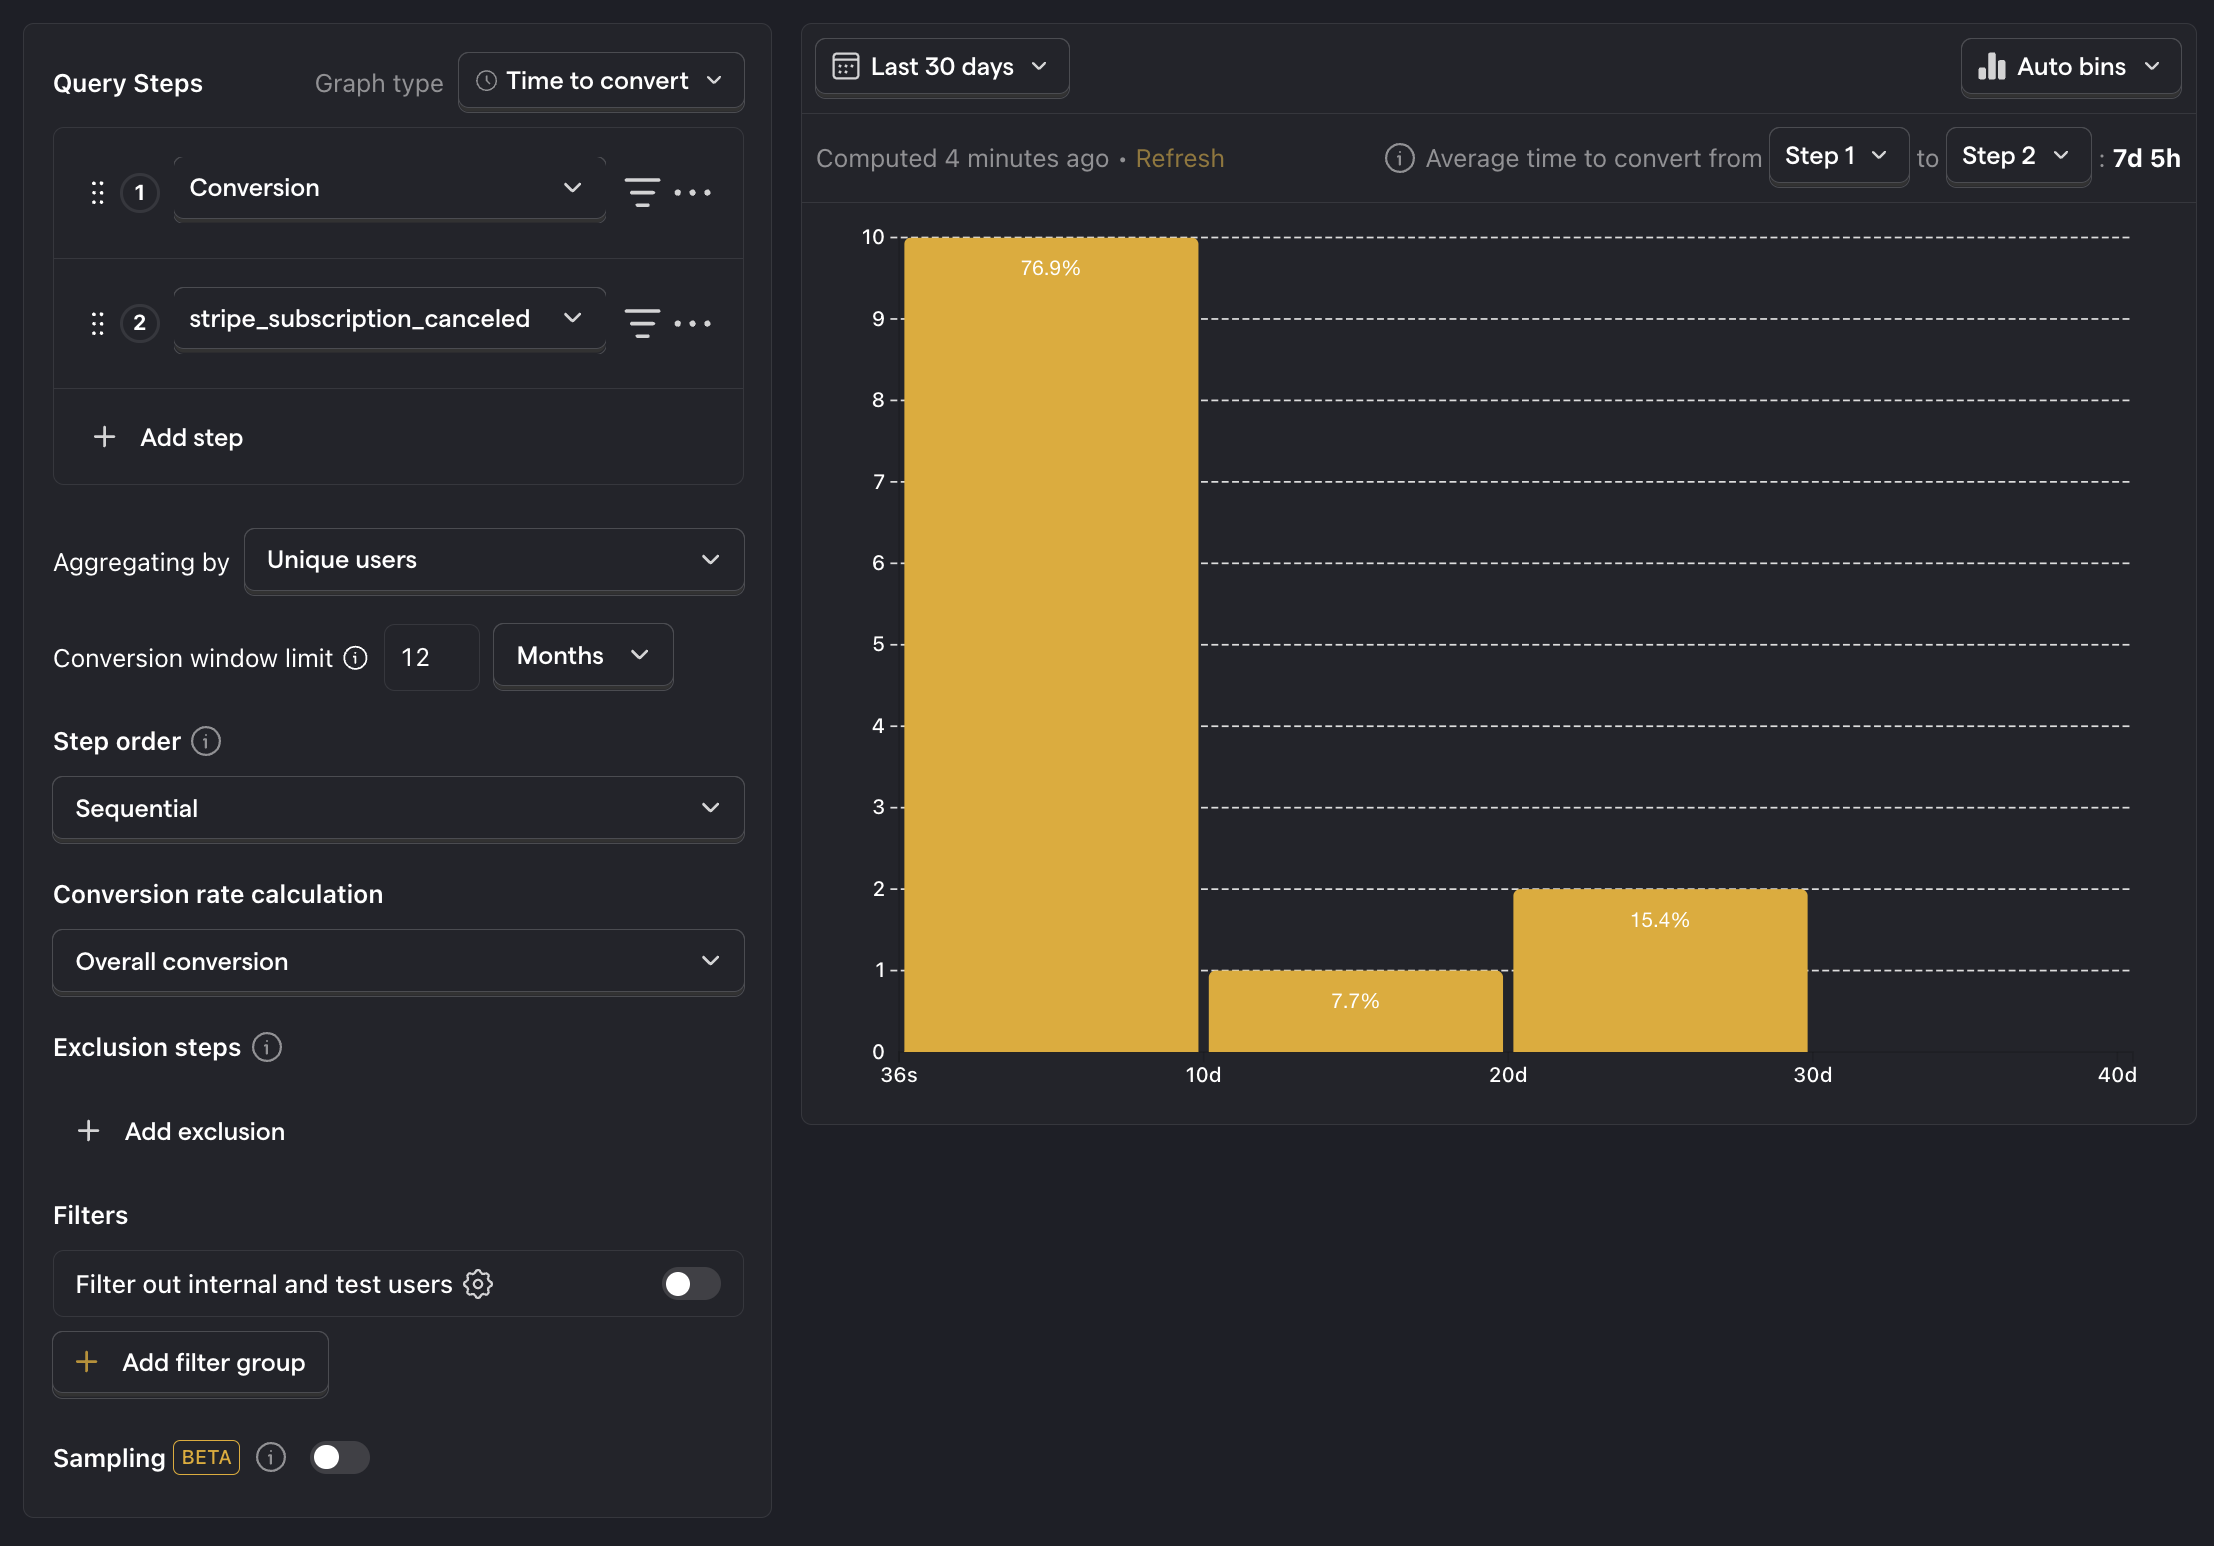
15. User lifetime
What is it? The average length of time a user remains active before churning.
Why is it useful? Provides insight into the overall health of your app and helps in forecasting long-term user behavior.
Good benchmark: Retaining 24% or more of users after their first day, and more than 4% after their first month10
Questions to ask:
- What actions or behaviors are associated with longer user lifetimes?
- How does user lifetime correlate with lifetime value (LTV)?
- What is the impact of customer support interactions on user lifetime?
How to track it: Create a funnel with your conversion and churn events. Set the graph type to Time to convert. Make sure to set the conversion window limit to 12 months (or whatever makes sense for your app).
App revenue metrics
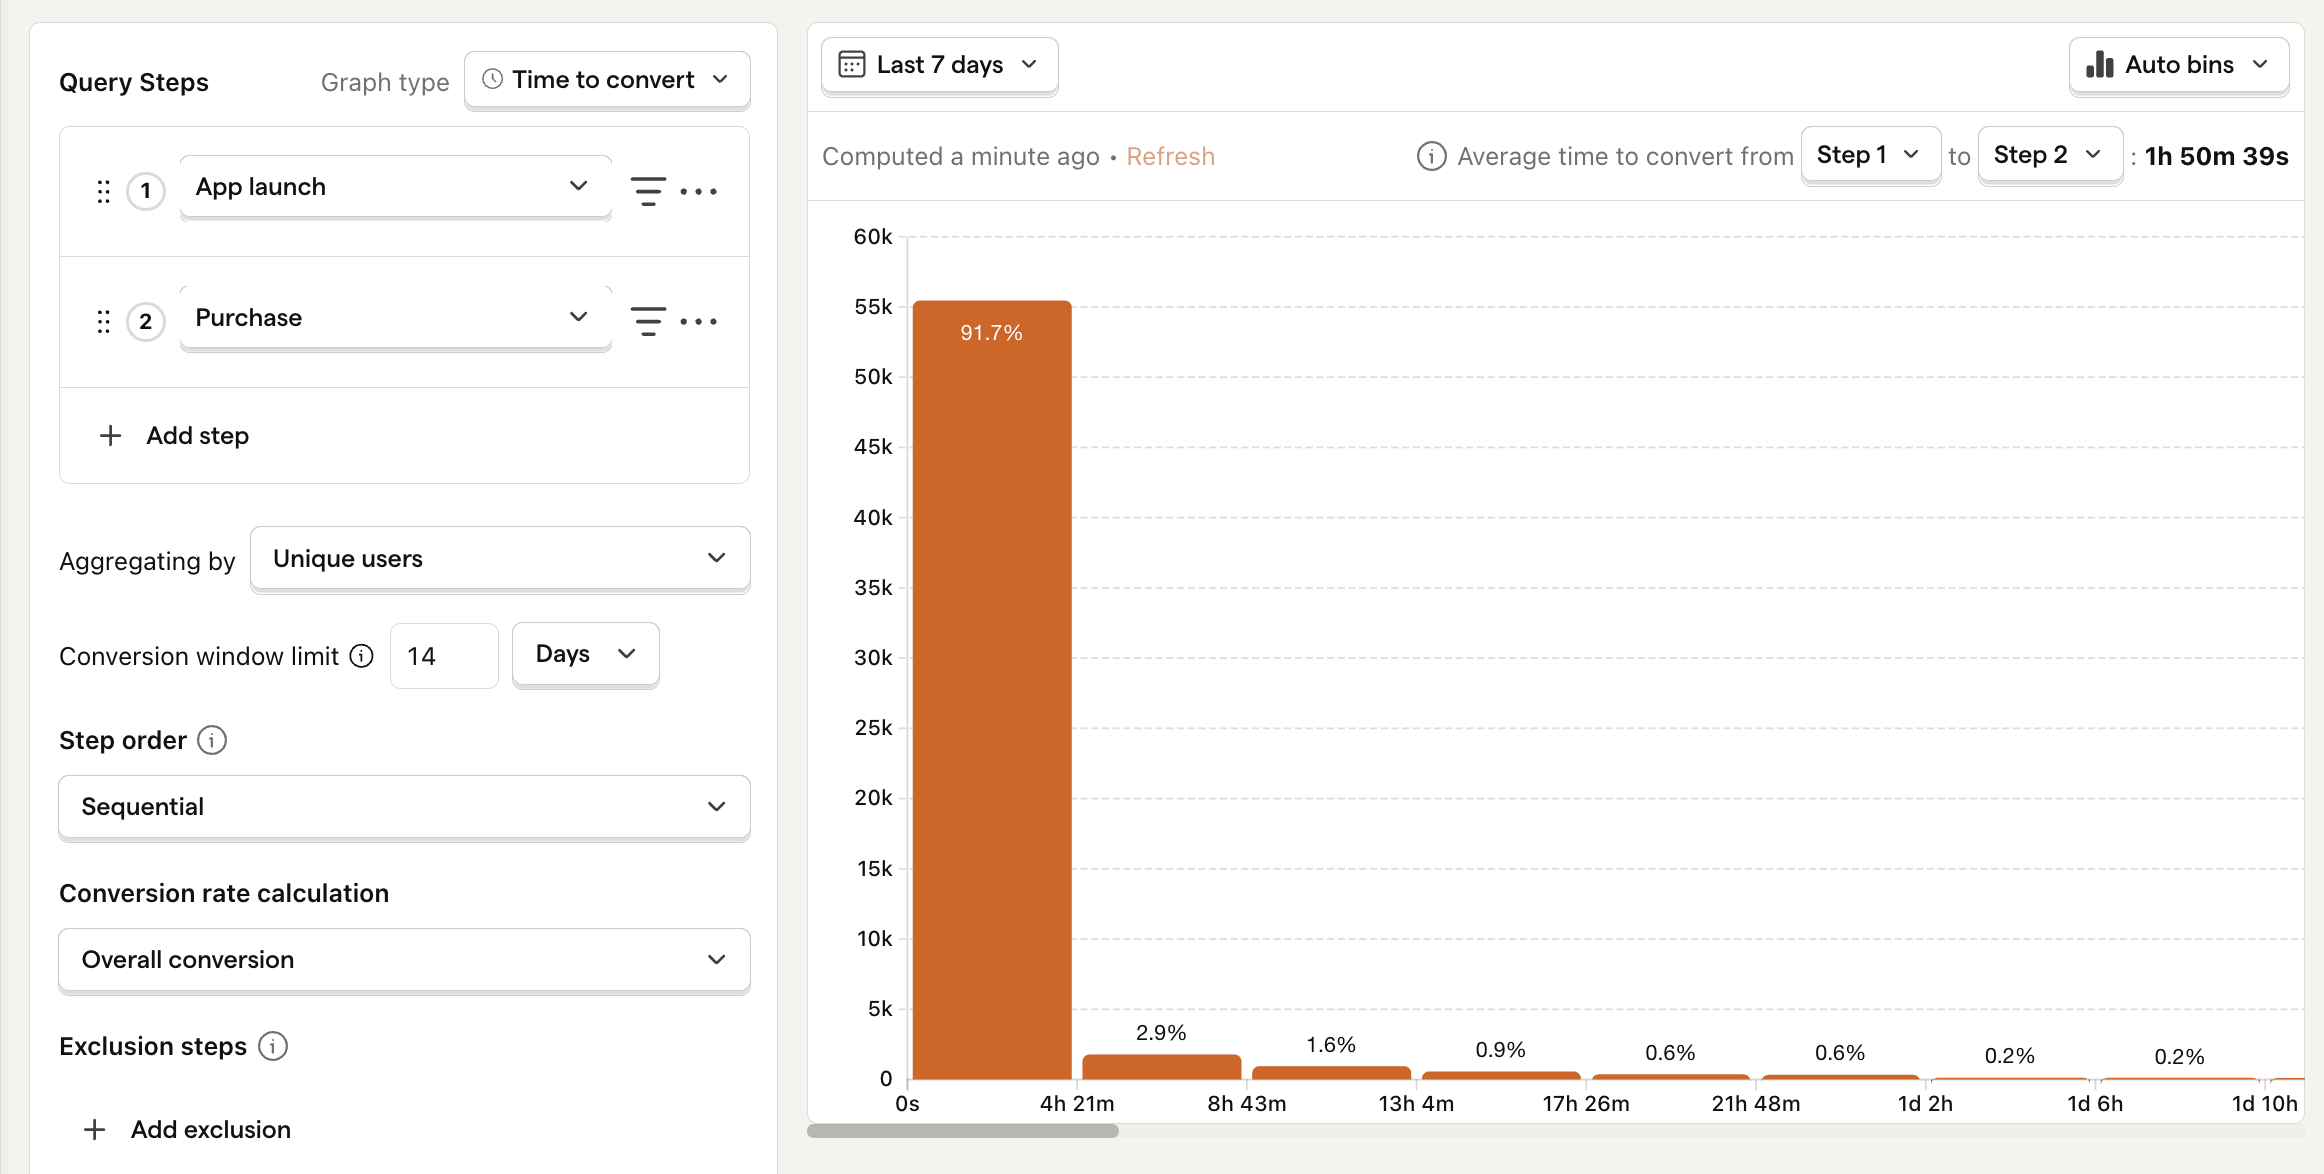
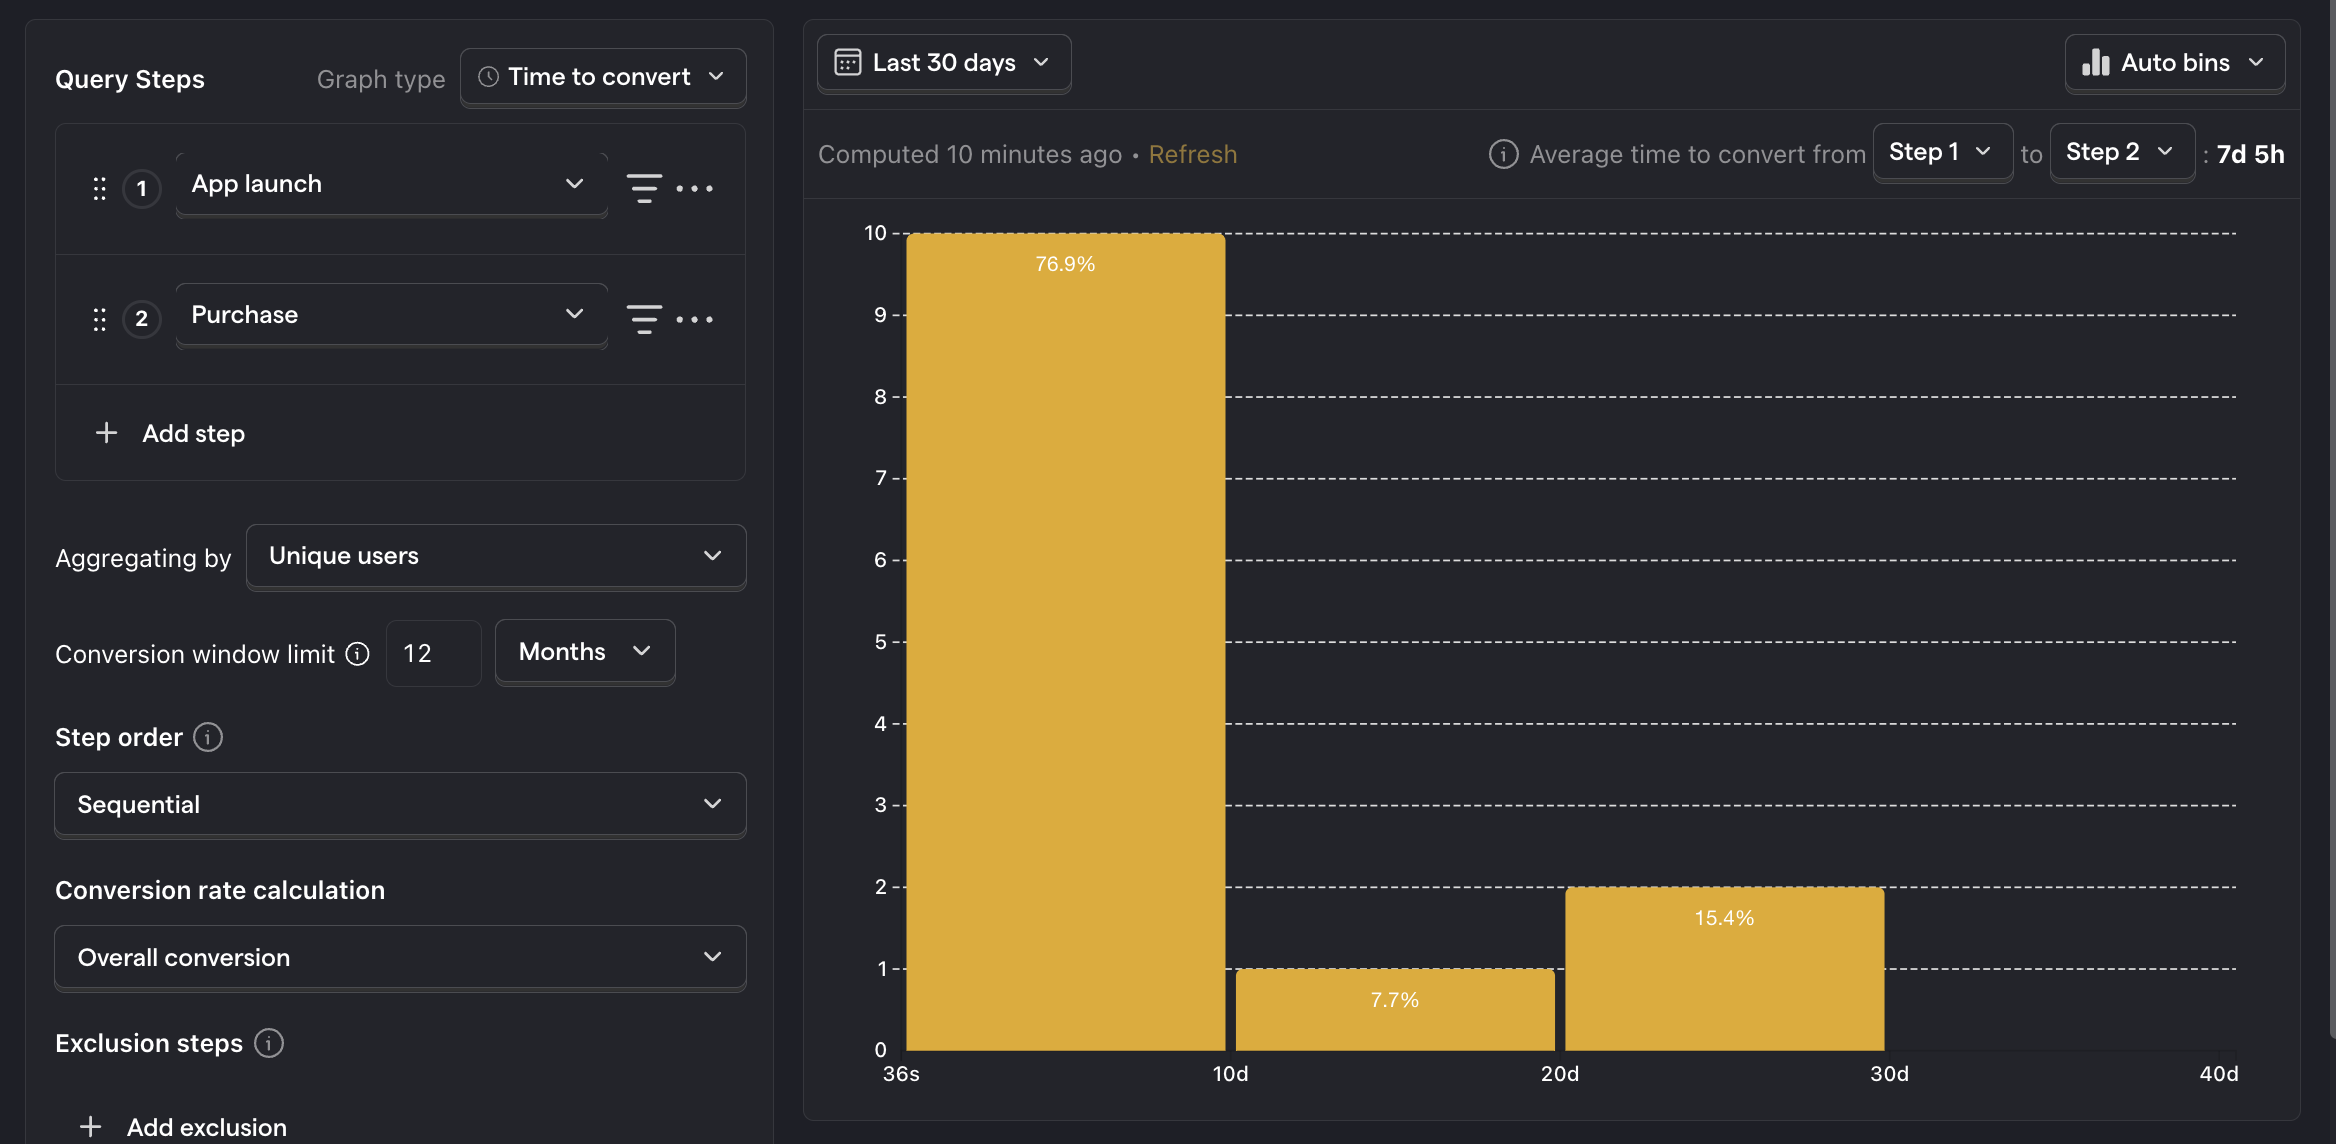
16. Average time to first purchase
What is it? The time it takes for users to make their first purchase.
Why is it useful? Similar to activation time, it's a strong indication of how long it takes for users to understand your app's core value prop.
Good benchmark: Varies depending on the app type.
Questions to ask:
- Which marketing channels or user acquisition methods lead to faster first purchases?
- Are there specific in-app events or interactions that typically precede a user's first purchase?
- How does pricing strategy or promotional offers impact the time to first purchase?
How to track it: Create a funnel with your app launch and purchase events. Set the graph type to Time to convert.
17. Refund rate
What is it? The percentage of payments that are refunded.
Why is it useful? Highlights customer satisfaction and product quality issues.
Good benchmark: Less than 3%11
Questions to ask:
- Are there specific features or in-app purchases that have higher refund rates?
- How does the refund rate vary across different user segments (e.g., new vs. long-term users)?
- Is there a correlation between refund rates and specific app versions or updates?
How to track it: Capture events whenever a user makes a purchase and requests a refund. Then create a trend insight with formula mode. Set your A-series to your purchase event and the B-series to refund event. Then type B / A in the formula box.
18. Revenue per paying user
What is it? Total revenue divided by the number of paying users.
Why is it useful? Shows you how much revenue on average each paying user is generating for you.
Good benchmark: A life-time value (LTV) of $80 or more for travel apps, $38 for e-commerce apps, and $2.50 for gaming apps12
Questions to ask:
- What are the differences between the top 10% who generate the most revenue versus the rest of the users?
- What is the impact of customer support interactions on revenue per paying user?
How to track it: Capture events whenever a user makes a purchase and set the amount paid as a property. Then create a trend insight with formula mode. Set your A-series to your purchase event and change the aggregation type to Property value - sum and select the amount paid property. Then set the B-series to your purchase event, but this time set the aggregation type to Unique users. Finally, type B / A in the formula box.
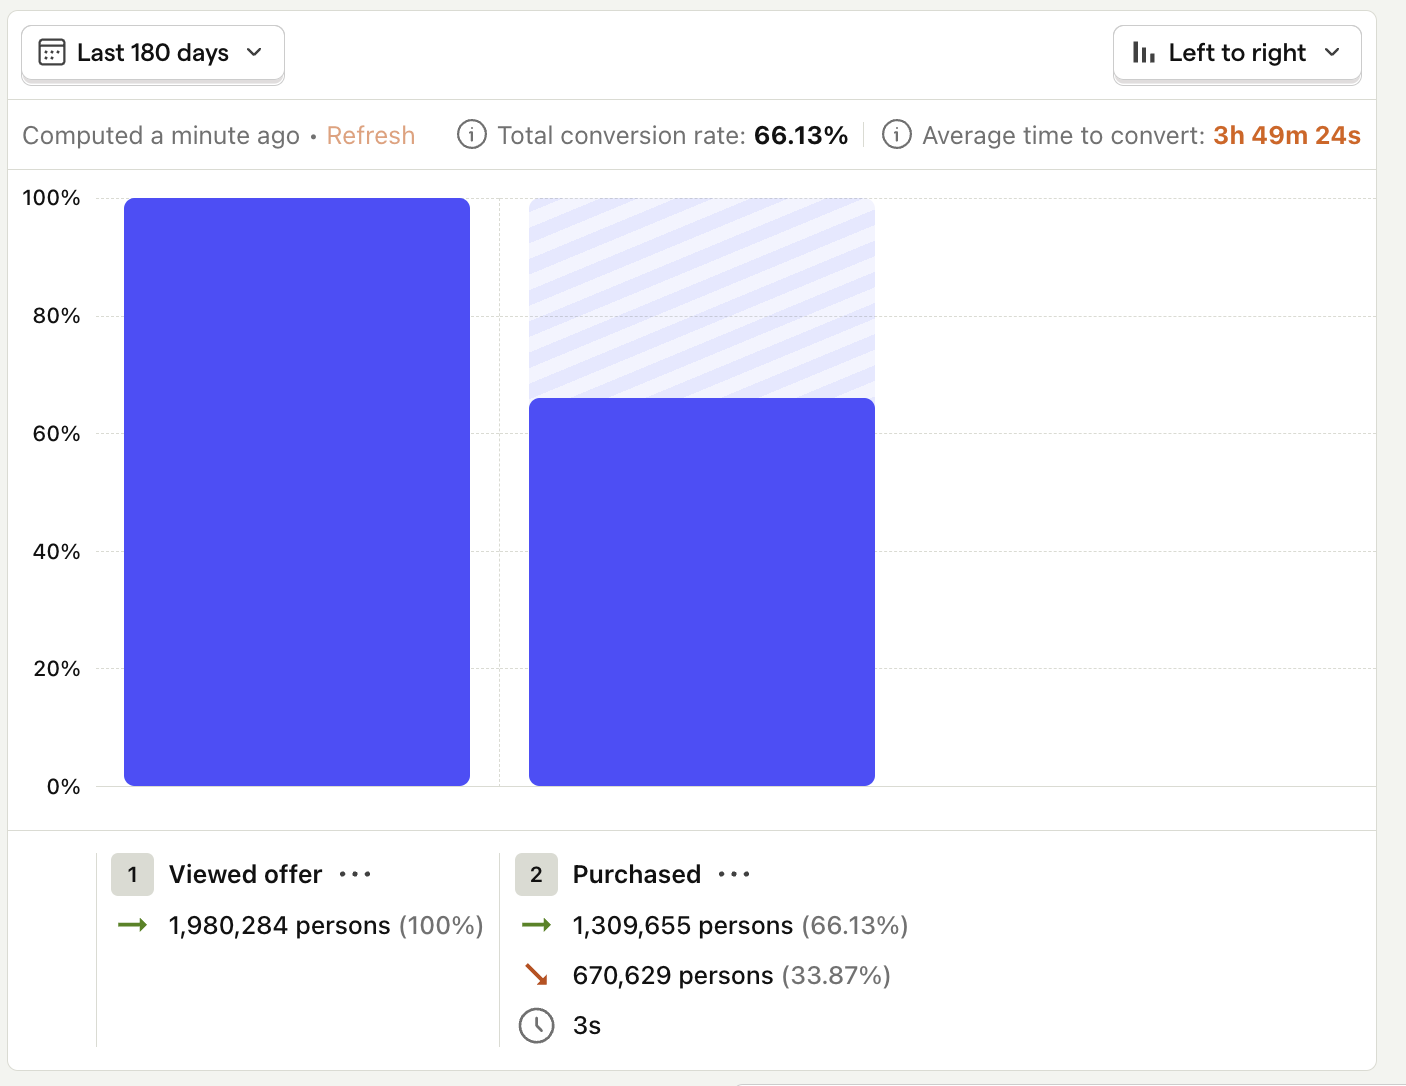
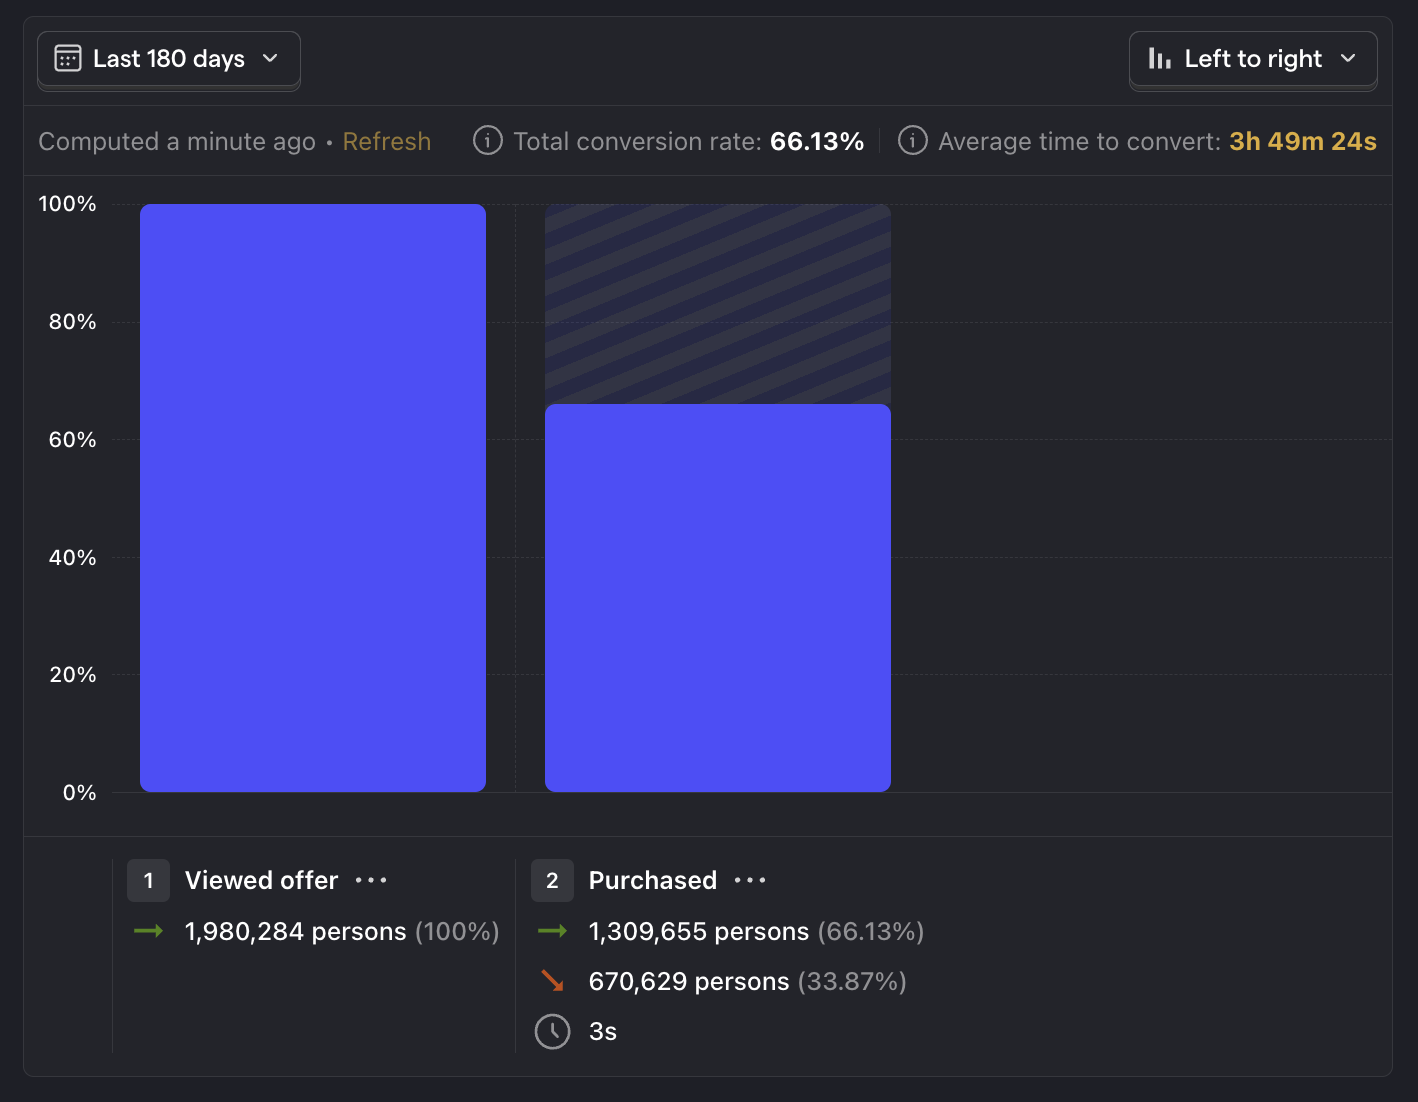
19. In-app purchase conversion rate
What is it? The percentage of users who make an in-app purchase.
Why is it useful? Indicates how appealing your app's premium features are.
Good benchmark: Above 2%13
Questions to ask:
- How does the conversion rate vary for different types of in-app purchases?
- What user behaviors or app interactions correlate with higher conversion rates?
- How do promotional offers or discounts impact the conversion rate?
How to track it: Capture events whenever a user views an in-app offer and also when they make a purchase. Create a funnel with these events.
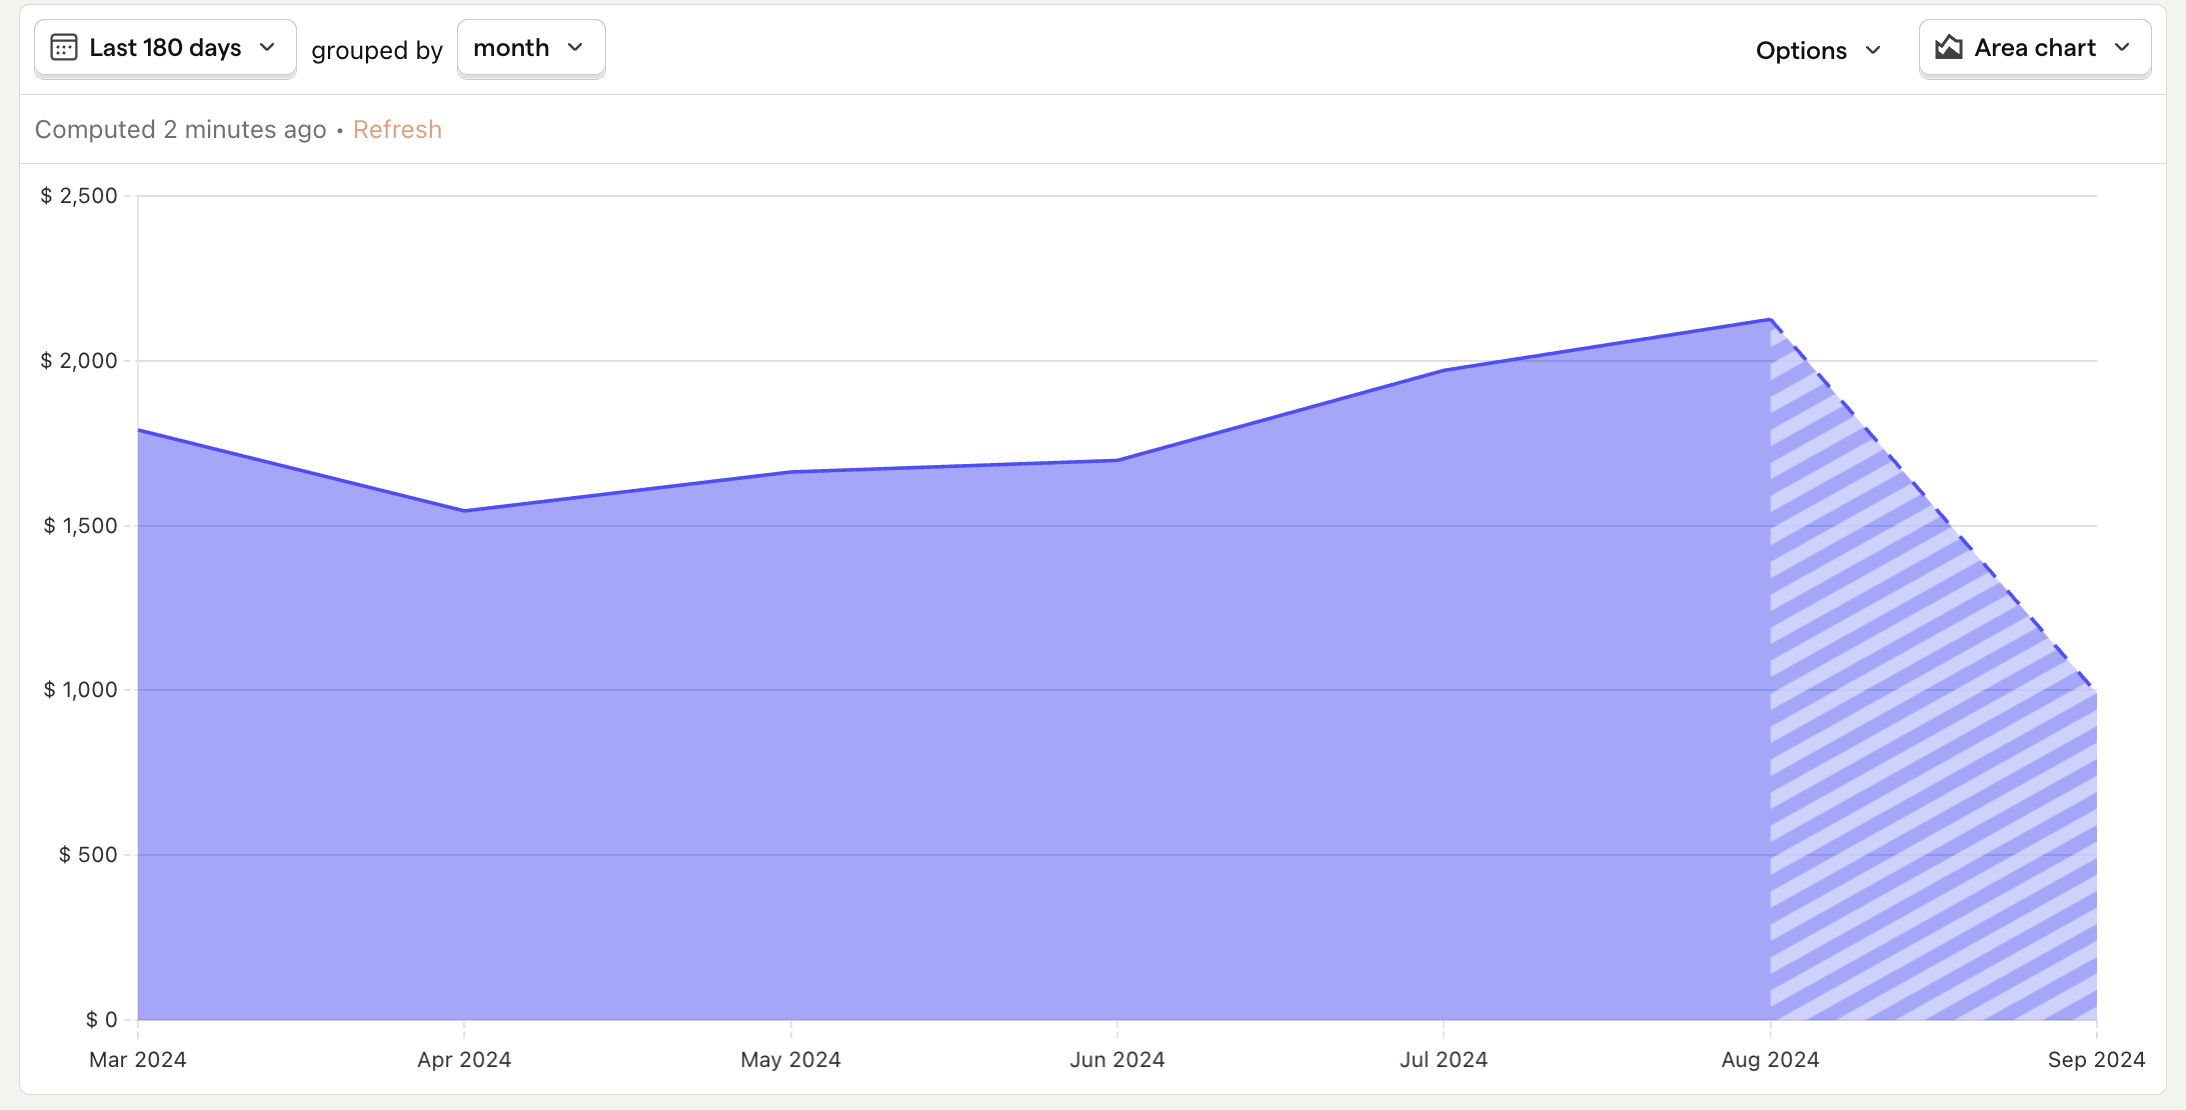
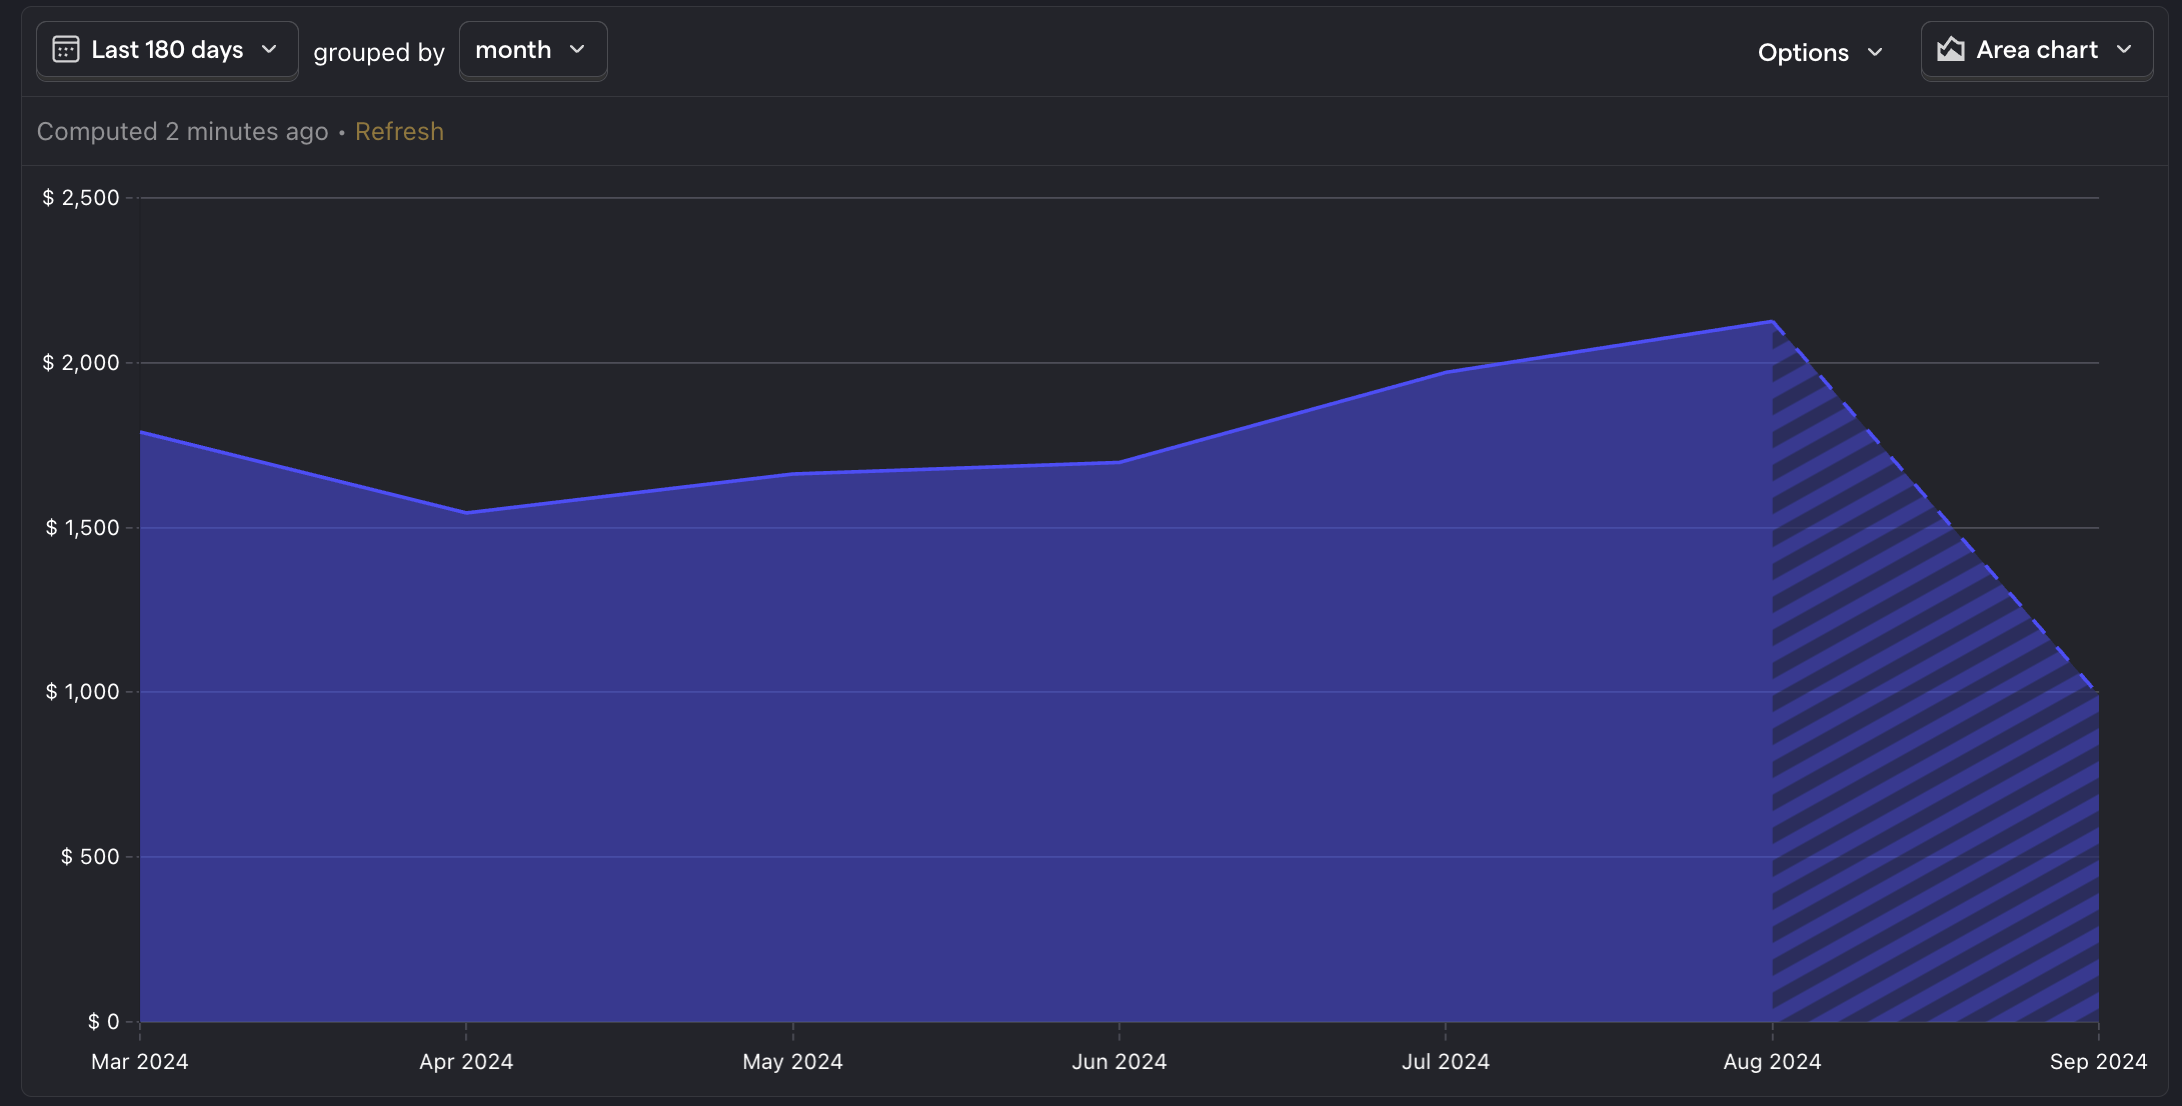
20. Revenue churn
What is it? The amount of revenue lost per month from canceled subscriptions.
Why is it useful? Measure customer loyalty and identify potential issues in your product or pricing strategy.
Good benchmark: 15% for weekly and monthly subscriptions, 41% for annual subscriptions14
Questions to ask:
- What are the key drivers of revenue churn? For example, price changes, product updates, or something else?
- Is there a correlation between the timing of subscription renewals and revenue churn rates?
- What is the impact of customer onboarding on reducing revenue churn?
How to track it: Whenever a user cancels their subscription, capture an event and set the revenue amount as property. Then create a trend using this event, set the aggregation type to Property value - sum, and then select the revenue property.
App performance and error metrics
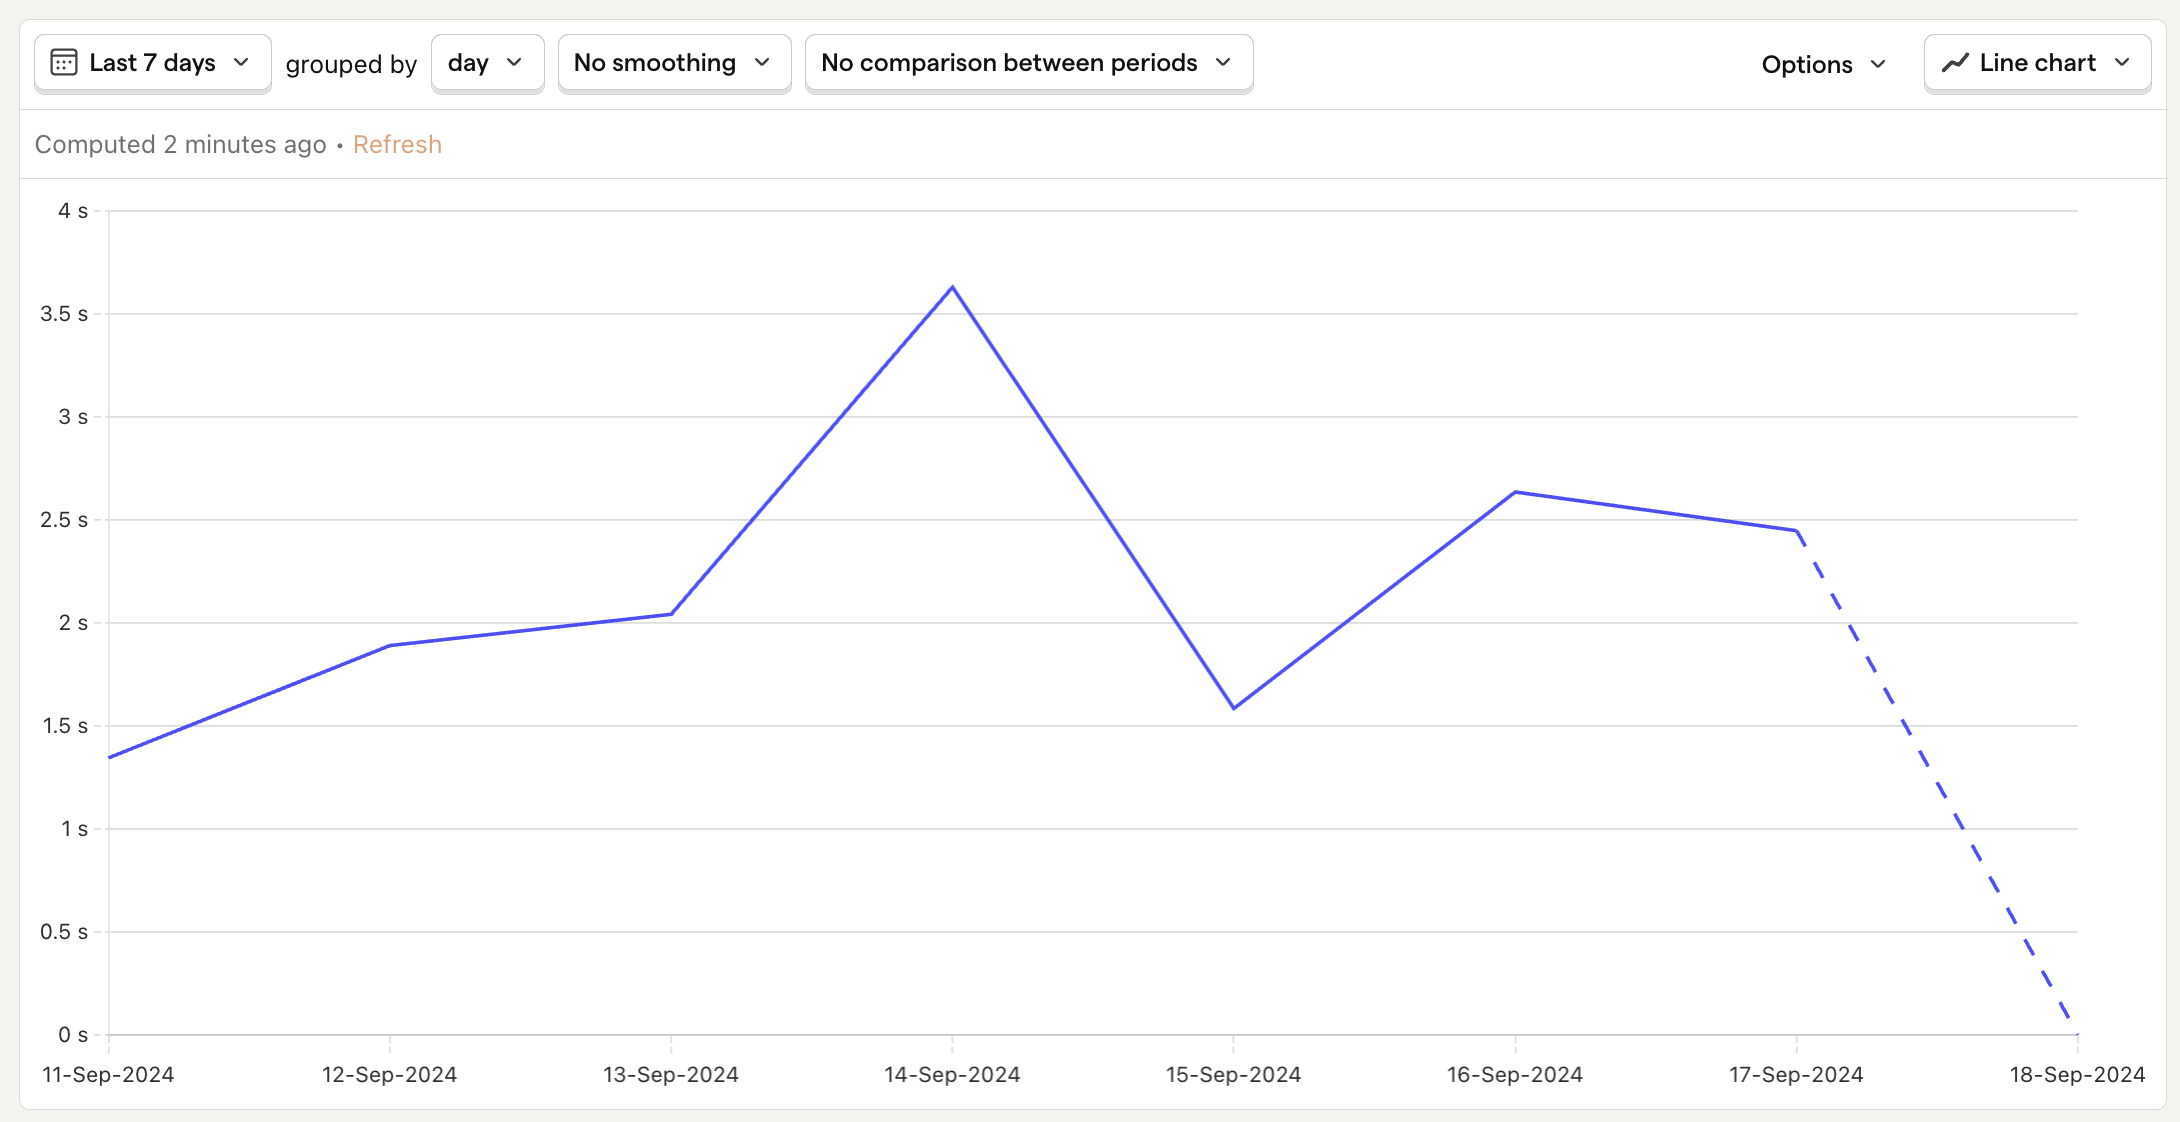
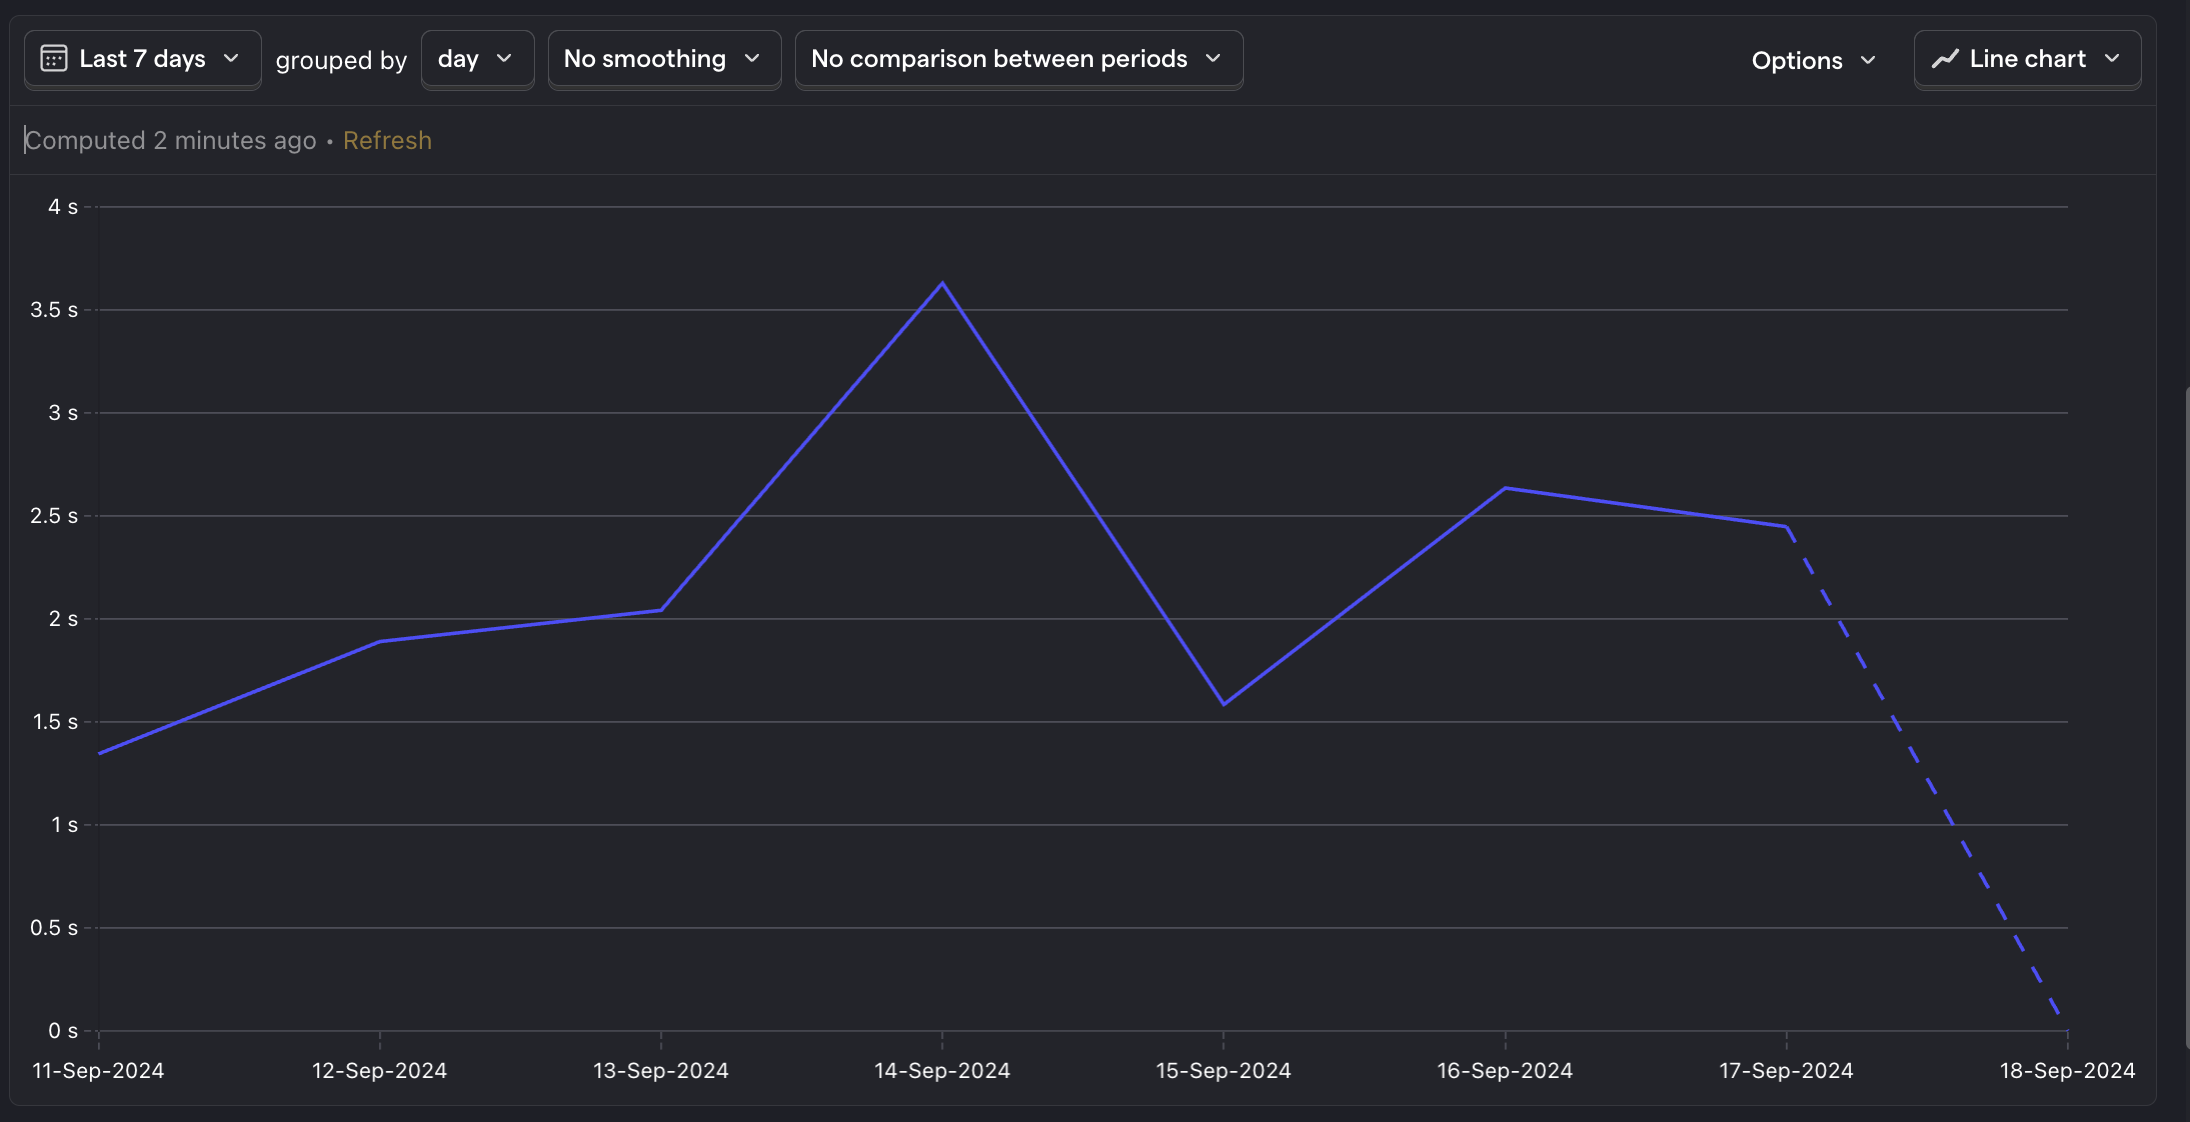
21. API response time
What is it? The time it takes to receive a response from your API endpoints.
Why is it useful? Helps identify performance bottlenecks and ensures your UX meets user expectations for responsiveness.
Good benchmark: Below 1 second is good. Anything above 1 second and users begin to notice some delay.
Questions to ask:
- What is the average latency for different types of API requests?
- How does latency vary across different devices and network conditions?
- Are there specific features or interactions that contribute to increased latency?
How to track it: Whenever you make an API request, capture an event with time taken to receive a response. Then create a trend and set the aggregation type to Property value - average. Select the response time property.
22. API request error rate
What is it? The percentage of network requests that result in errors.
Why is it useful? Enables you to pinpoint problematic flows in your app.
Good benchmark: Less than 1%.
Questions to ask:
- What is the overall error rate, and how does it break down into client-side versus server-side issues i.e 4xx and 5xx error codes?
- What are the most common errors, and what are their causes?
- Are there specific features or scenarios that are more prone to errors?
How to track it: Capture events both when you make an API request and when they return errors. Create a trend insight with formula mode, setting the A-series to API request made and B-series to API request error. Then in the formula box type B / A.
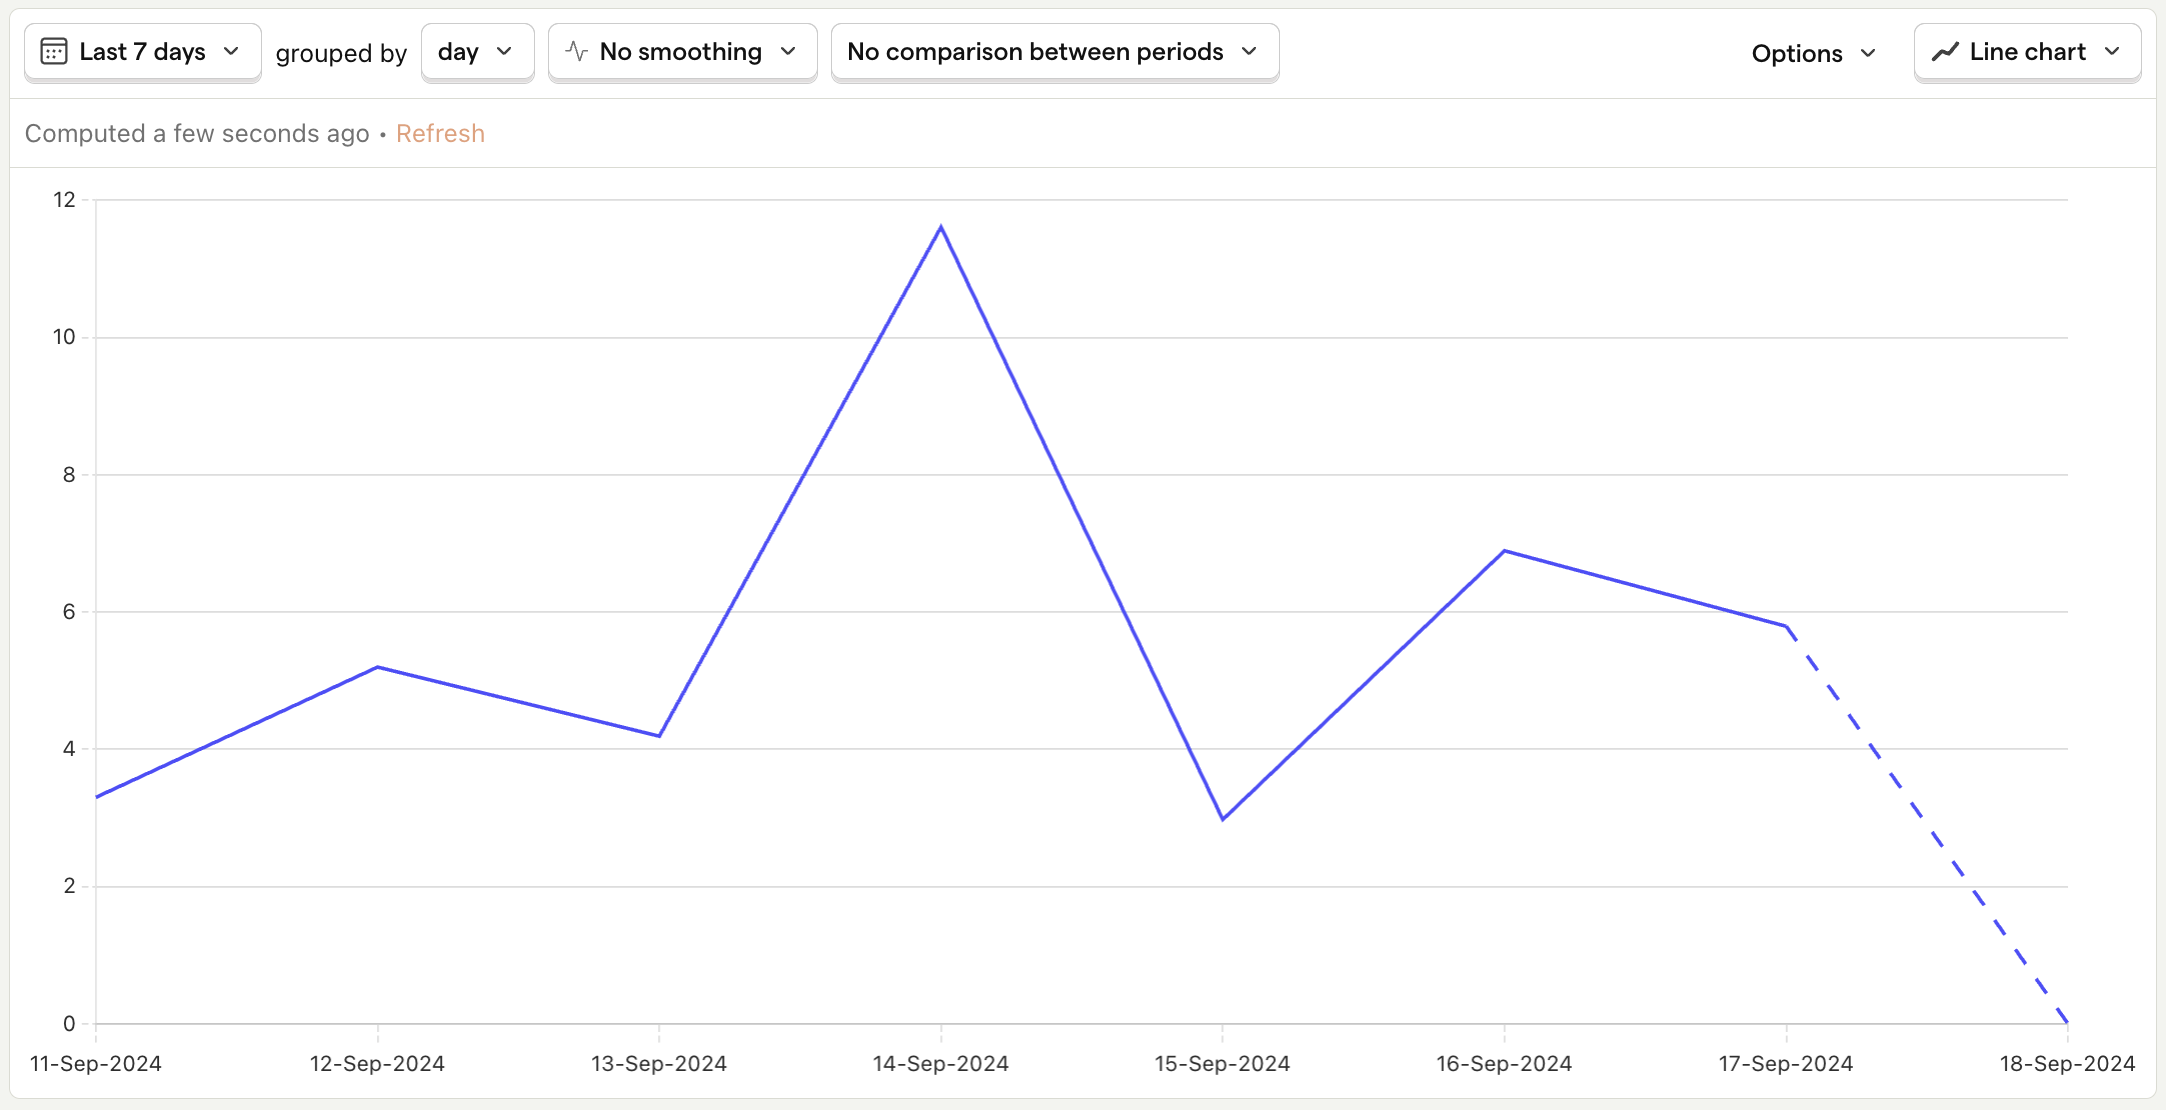
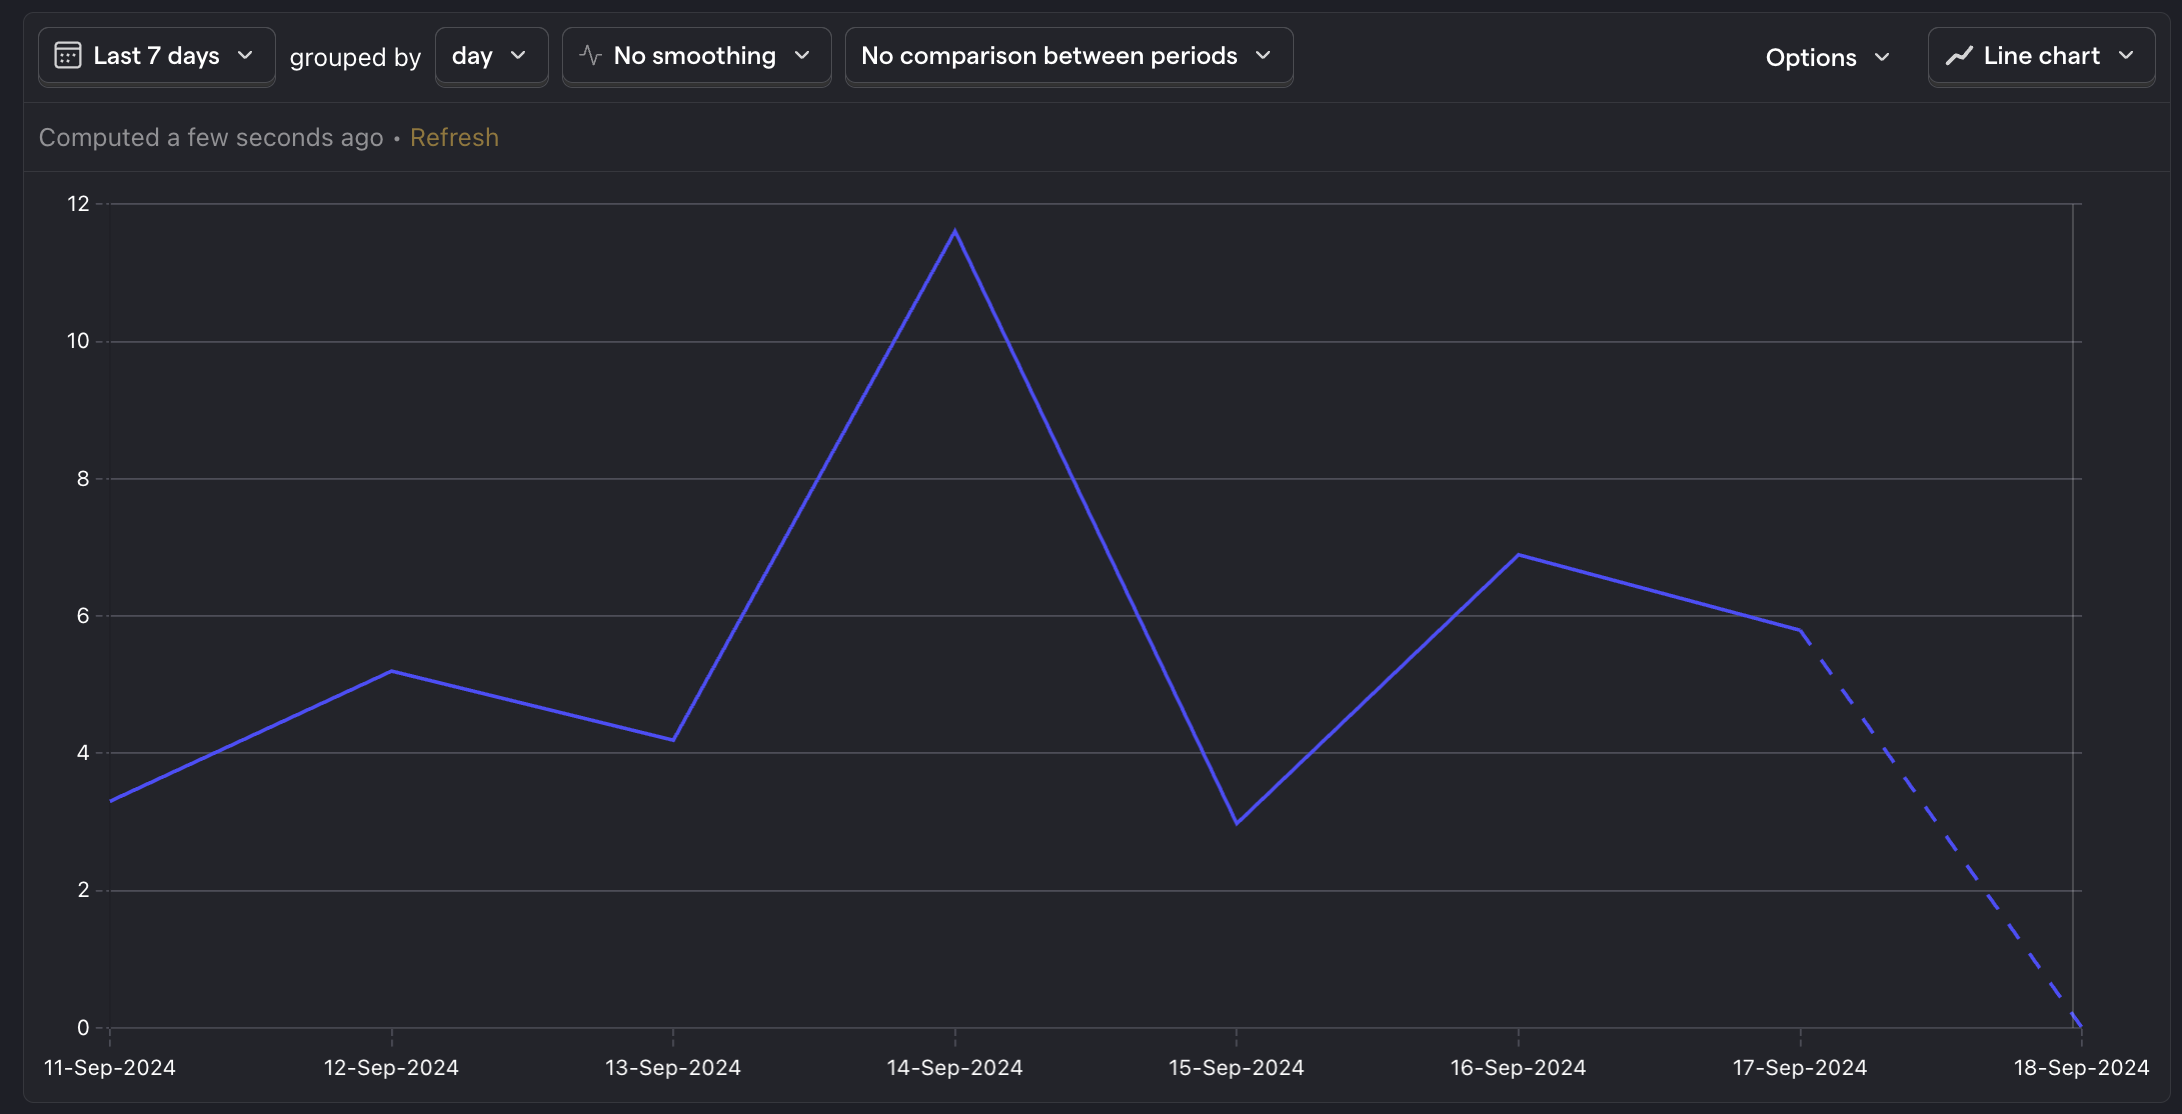
23. App launch time
What is it? The time it takes for your app to become responsive when opened.
Why is it useful? User's expect apps to be responsive, and a slow launch time can be off-putting to users.
Good benchmark Apple recommends at most up to 400ms to render the first frame. Google recommends cold launches to be below 5 seconds and hot launches to be below 1.5 seconds.
Questions to ask:
- How does the app launch time vary across different devices and network conditions?
- What are the most common causes of slow app launch times, and how can they be addressed?
- How does app launch time correlate with user engagement and satisfaction?
How to track it: When you capture an app launch event, include the time taken as a property. Then create a trend to view this metric.
24. Percentage of users who experience crashes or errors
What is it? How many of your overall users are affected by crashes and/or errors.
Why is it useful? Gives you a sense of how many of your users are having a bad experience with your app.
Good benchmark: Less than 1%15
Questions to ask:
- How does the crash rate vary across different devices and app versions?
- Which features are most likely to cause errors?
- How does this rate correlate with user retention and churn?
How to track it: Create a trend insight with formula mode. Set the A-series to Screen view and aggregation to Unique users. Set the B-series to the error event and aggregation to Unique users. Lastly, type B / A in the formula box.
25. p95 errors per user
What is it? The number of errors experienced by the top 5% of users who encounter the most issues.
Why is it useful? Helps you identify the users who are most affected by errors.
Good benchmark: Not applicable.
Questions to ask:
- What are common characteristics of users who experience the most errors?
- Which features are the most problematic for these users?
- How do error rates change after app updates for these users?
How to track it: Create a SQL insight with the following query:
Further reading
- Best mobile app analytics tools
- The 9 best mobile app A/B testing tools
- 7 best session replay tools for mobile apps (iOS & Android)
Footnotes
- App Metrics: 10 KPIs to Track for Mobile App Success – Contentsquare↩
- App Activation Rates – Business of Apps↩
- Mobile App Retention Rate – Statistics and Trends – Business of Apps↩
- NPS vs CSAT vs CES: Which one should you use? – PostHog↩
- In-App Response Rates – Business of Apps↩
- App Engagement Rates – Business of Apps↩
- App Retention Benchmarks – AppsFlyer↩
- App Churn Rates – Business of Apps↩
- App Reactivation Rates – Business of Apps↩
- App Retention Rates – Business of Apps↩
- App Refund Rates – Business of Apps↩
- LTV App Rates – Business of Apps↩
- Just 2% of app installs lead to purchases – Business Insider↩
- App Renewal Rates – Business of Apps↩
- App Performance Rates – Business of Apps↩